My Take on the Carbon Dioxide Narrative: Conclusion
Preamble
After many (I wish I had logged) research and writing hours, 16, 000+ words, 70+ images and six posts later (seven including this one), I could easily end this little mini-series with the same sentence with which it began:
TL;DR
There’s no global warming spiralling out of control, and our climate is predominantly driven by the Sun.
But I won’t, because when I wrote that back in April this year 2023, I had no idea I’d still be writing on this subject six posts and just over six months later!
“Spiralling out of control” was a dig at the climate activists who don’t so much say that either, but do imply, strongly, that warming is out of control and destroying the planet.
It is not intellectually honest to use this hyperbolic phrase in my conclusion on this topic. Therefore I shall rephrase my sentence to the one I wish in retrospect I had written in the Introduction:
There is no man-made CO2-driven global warming, and our climate is predominantly driven by the Sun.
This is much more in keeping with what most people would genuinely believe the “climate debate” to be about if asked, too.
I’ll now break that sentence into two parts for a more rounded discussion.
Part 1: There is No Man-Made CO2-Driven Global Warming
There is No Man-Made Global Warming
(Otherwise known as Anthropogenic Global Warming, or AGW.)
Note how I didn’t say “there’s no global warming" — there definitely has been, but it wasn’t due to man, and it is that detail which is important.
‘Climate scientists’ (really global warming alarmists) like to produce charts like the one below, to convey the impression that temperatures are on the verge of soaring exponentially:
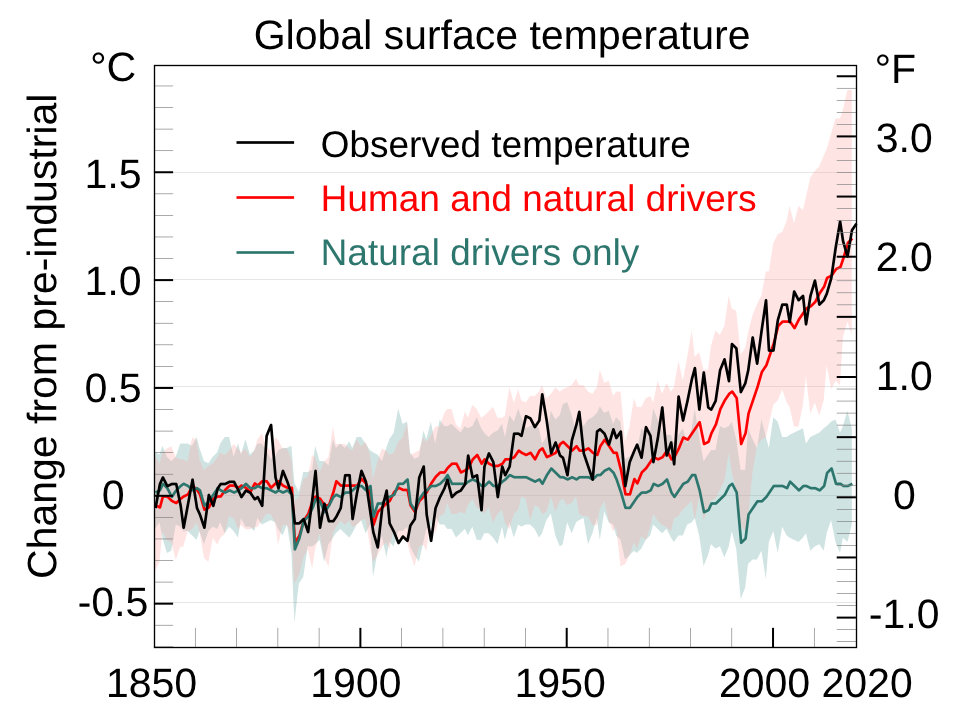
Attribution: Efbrazil, CC BY-SA 4.0 , via Wikimedia Commons
What they omit to say is that the period from about 1300 until about 1850 (some people define a smaller range within this range, from the 16th to 19th century) — when the above graph conveniently begins — was known as The Little Ice Age, with temperatures lower than currently. So cold that the Thames River and other European rivers would freeze solidly enough that markets and recreational activities were often held on the ice:
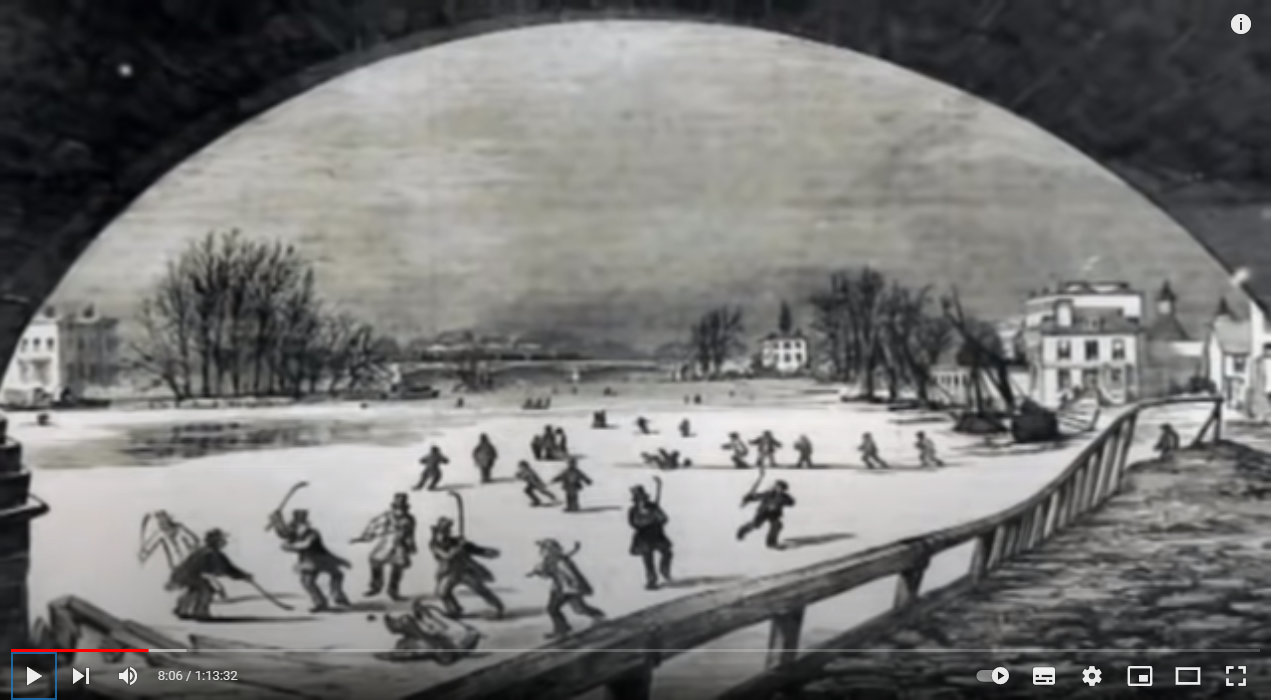
Source: https://youtu.be/BY-gRFSaP7o?t=487
It is hardly surprising that an Earth coming out of such a cold period means a warming Earth by default! And warming so slowly that there has not been even a 1.5 °C increase in 170 years. Observe the modern temperature at far right of this graph below and compare with the Mediaeval Warm Period, so warm that grapes were grown in Scotland:
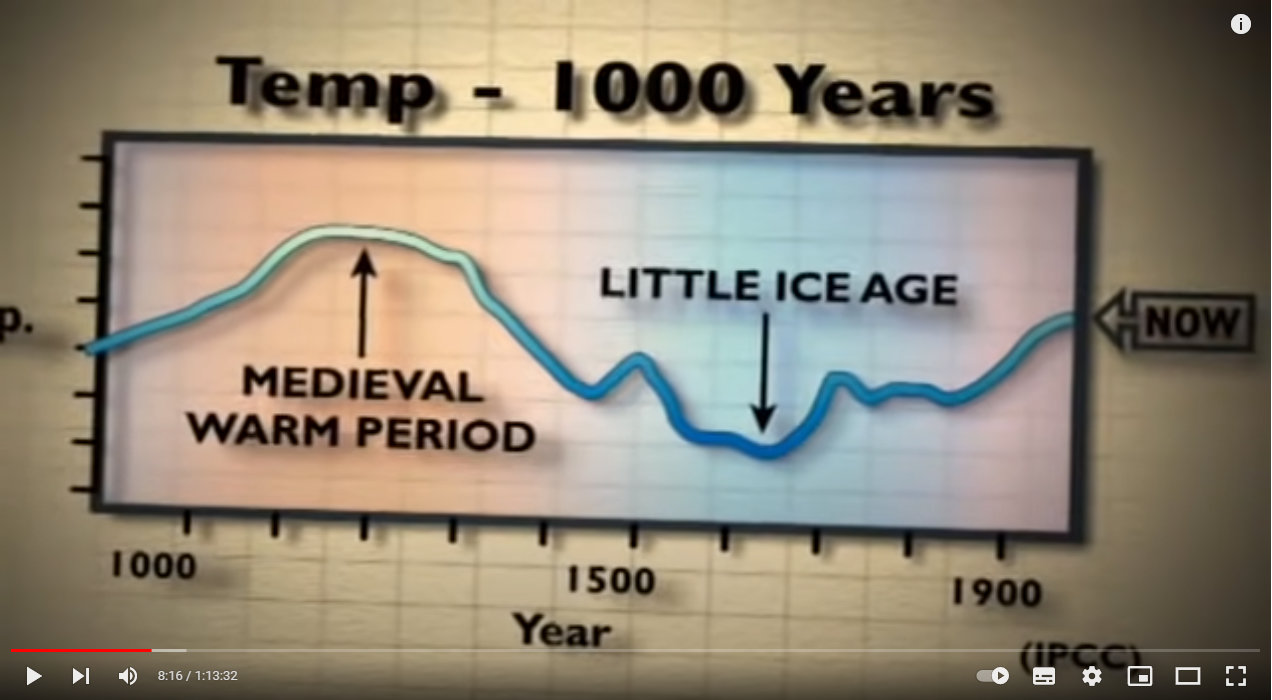
Source: https://youtu.be/BY-gRFSaP7o?t=496
Most people don’t even know about this very warm period, and in fact, an Oklahoma geoscientist named David Deming testified in 2006 that a leading climate scientist had emailed him in 1995 stating “We have to get rid of the Medieval Warm Period.” (Cue Michael Mann and his long-since discredited ‘hockey stick graph’ in which the Mediaeval Warm Period did indeed vanish. Which is why pointing out the Mediaeval Warm Period comes as such a surprise to many.)
The activists also fail to tell you that the Earth’s temperature hasn’t risen since 1998.
Speaking of temperature recording, please find below how an official thermometer was placed at an Ohio location! What happened to Stevenson screens?
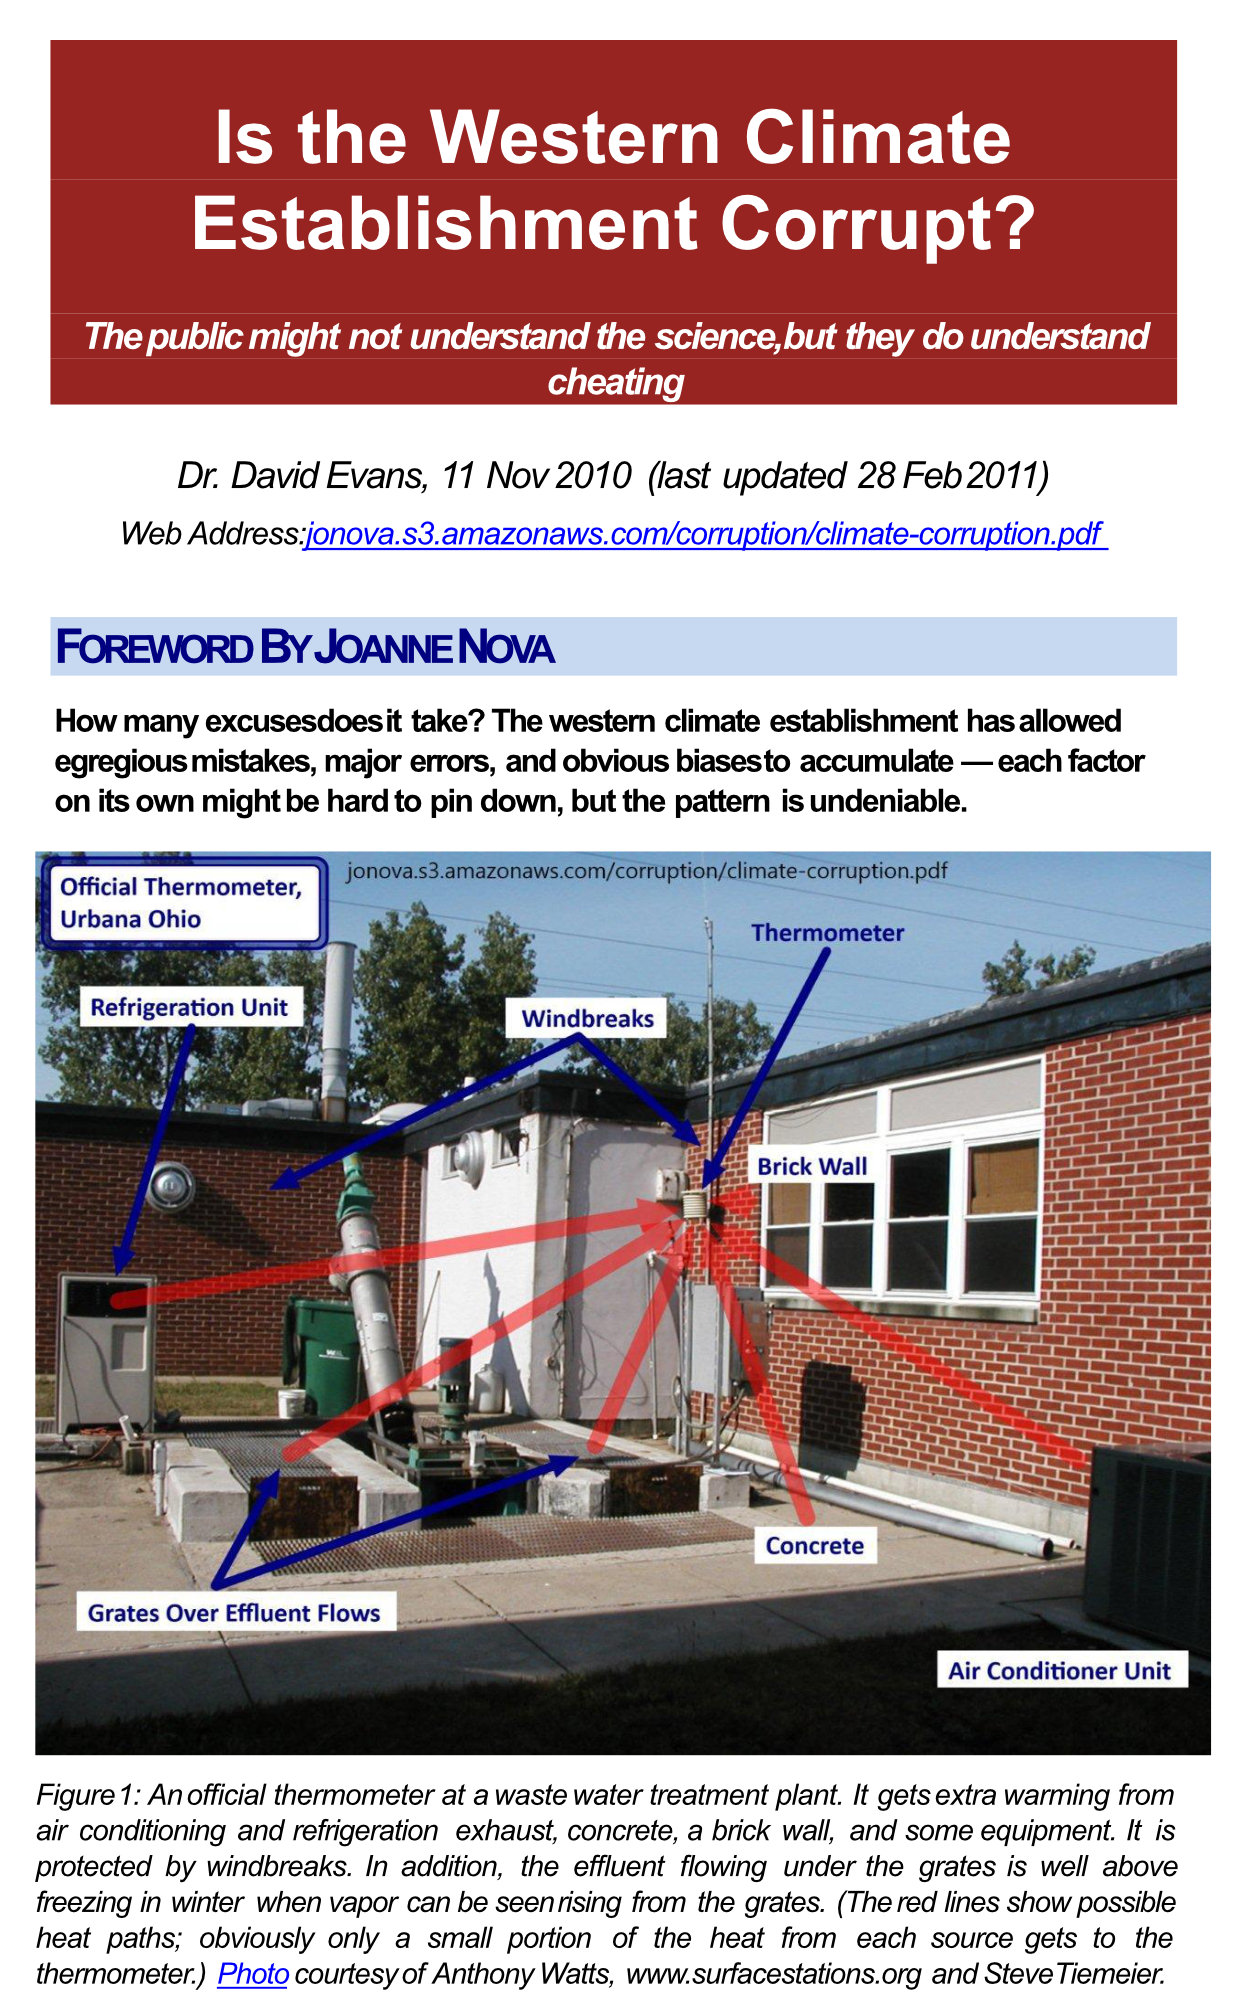
Photo (http://gallery.surfacestations.org/main.php?g2_itemId=5322) courtesy of Anthony Watts, www.surfacestations.org and Steve Tiemeier
Source: https://joannenova.com.au/s3/jonova.s3.amazonaws.com/corruption/climate-corruption.pdf
And should you think this is just a cherry-picked example, please do click on the above image to see photo after photo of equally poorly- (deliberately-) placed thermometers in the (2010, updated 2011) PDF from which it came (thanks Phil again for the link!).
From page 2:
These photos speak for themselves. The corruption of climate science has become so blatant, so obvious, that even non-scientists can no longer throw their hands in the air and say “I didn’t know”. You don’t need a PhD to know it is cheating to place thermometers near artificial heat sources and call it “global” warming.
And later, on page 15:
They have tacitly admitted their land-thermometer data [especially when compared with the superior satellite data —see pages 13-14] is deeply flawed by setting up a new network of properly sited thermometers (which won’t produce a meaningful trend for 50 years) and by ceasing to use individual thermometers that get ridiculed on the Internet. Obviously this goes beyond mere incompetence.
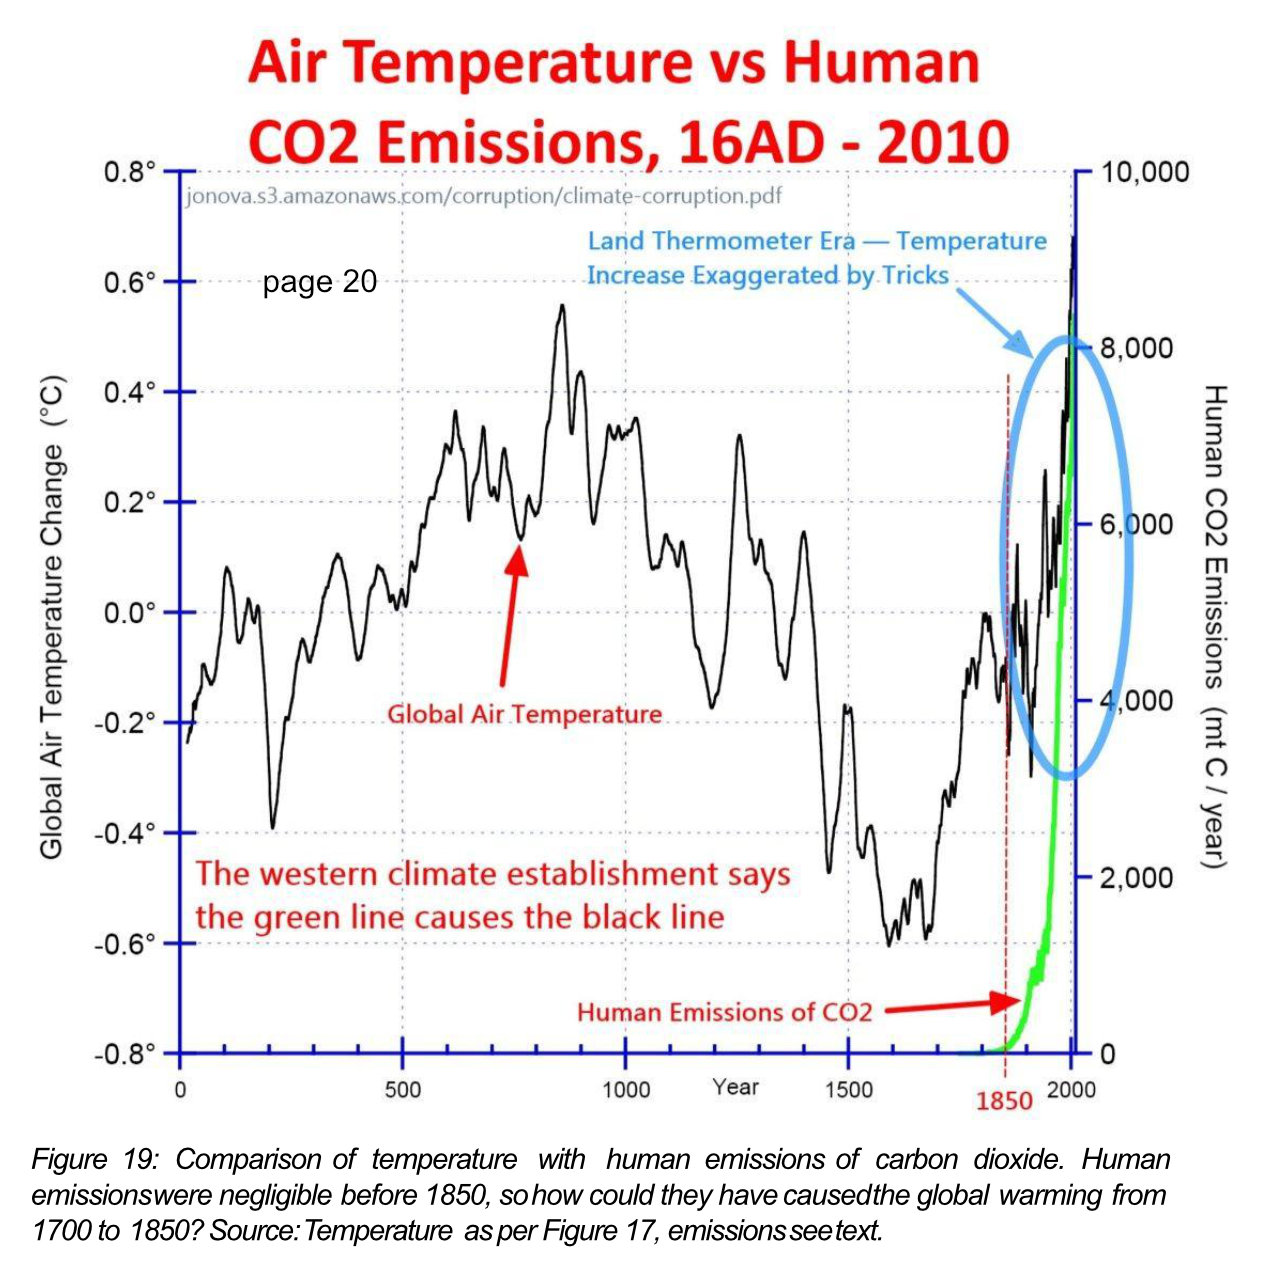
Further on, on page 20, the author made a very valid point: “Notice how they never directly compare temperature with human emissions of CO2?”
In other words, all the graphs ever presented to you are those of temperature and total atmospheric concentrations of CO2. They are never of temperature and the human contribution to that total atmospheric concentration of CO2.
Why are such graphs never shown? Because should you ever track down such a graph, such as this one below on page 21:
Source: https://joannenova.com.au/s3/jonova.s3.amazonaws.com/corruption/climate-corruption.pdf
you’d readily see for yourself that (again on page 21):
The current global warming trend started before 1700, yet human CO2 emissions were negligible before 1850. So the theory that humans started the recent global warming is absurd and obviously wrong.
In Summary: There is warming, but it is the result of the Earth coming out of a little ice age. It is not anthropogenic, as evidenced by both the pre-dating Mediaeval Warm Period and the post-dating warming trend which pre-dates the Industrial Revolution.
That ‘climate scientists’ go to such lengths to ‘prove’ warming by placing official thermometers near heat sources and ‘disappearing’ the Mediaeval Warm Period really should make this case closed.
Most worrying and disturbing of all is that some of these ’scientists’ are so pathologically insane and hell-driven that they wish to block the Sun and force a cooling Earth.
There is No Man-Made CO2-Driven Global Warming
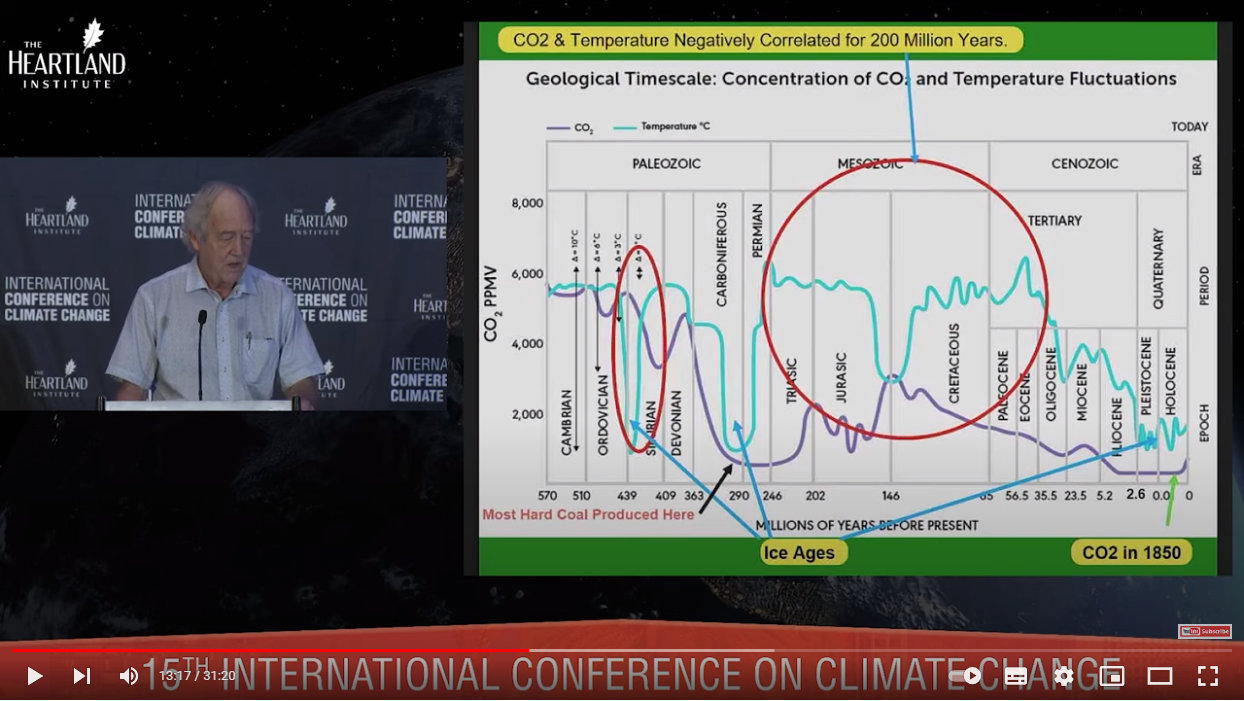
The graph below shows how atmospheric CO2 concentrations have never consistently correlated with temperature over 570 million years. The red circle shows that the two were negatively correlated for 200 million of those years — and that CO2 was at its highest when temperature was at its lowest.
Source: https://youtu.be/GH8v5aCbZBs?t=797
What is also conveniently ignored is how much CO2 there once was in the atmosphere. CO2 was close to 6, 000 ppm (0.6%, about 15 times today’s 400 ppm or 0.04%) when multicellular life first appeared 570 million years ago.
It was the biosphere which sucked that all out.
Firstly by marine life incorporating CO2 as calcium carbonate (CaCO3) into newly-evolved shells, which caused atmospheric CO2 to drop to about 5, 000 ppm (0.5%) around 360 million years ago — and to this day much of that CO2 is still locked away in the chalk, limestone and marble deposits of fossilised remains. The beautiful and impressive White Cliffs of Dover, all 110 m high and 13 km length of it, are the calcium carbonate remains of phytoplankton coccolithophores.
And secondly by the large trees which were making an appearance around 360 million years ago. These organisms incorporated so much CO2 as lignin, that atmospheric CO2 plummeted to 500 ppm, a level not much higher than today’s 400 ppm. It wasn’t until around 300 million years ago that the enzymes able to break down lignin first appeared, and that carbon could again re-enter the atmosphere (and the carbon cycle) as CO2 via microbial respiration. Even so, vast amounts of carbon are still locked away in vast coal deposits to this day, from the multitude of fossilised trees that couldn’t be biodegraded for 60 million years.
CO2 is a Nutrient, Not a Pollutant
Life removed CO2 from the atmosphere, as the atmosphere was — and still is — a ready source of this valuable nutrient. CO2 levels were so low at one point — around 275 ppm (0.0275%) in the early 1600s (about 34% lower than today) — that any lower and plant life would have been on the verge of extinction. It varies amongst the C3, C4 and CAM species, but once levels drop below 200 ppm (0.02%), plants become increasingly unable to fix CO2. Photosynthesis shuts down completely below 150-200 ppm.
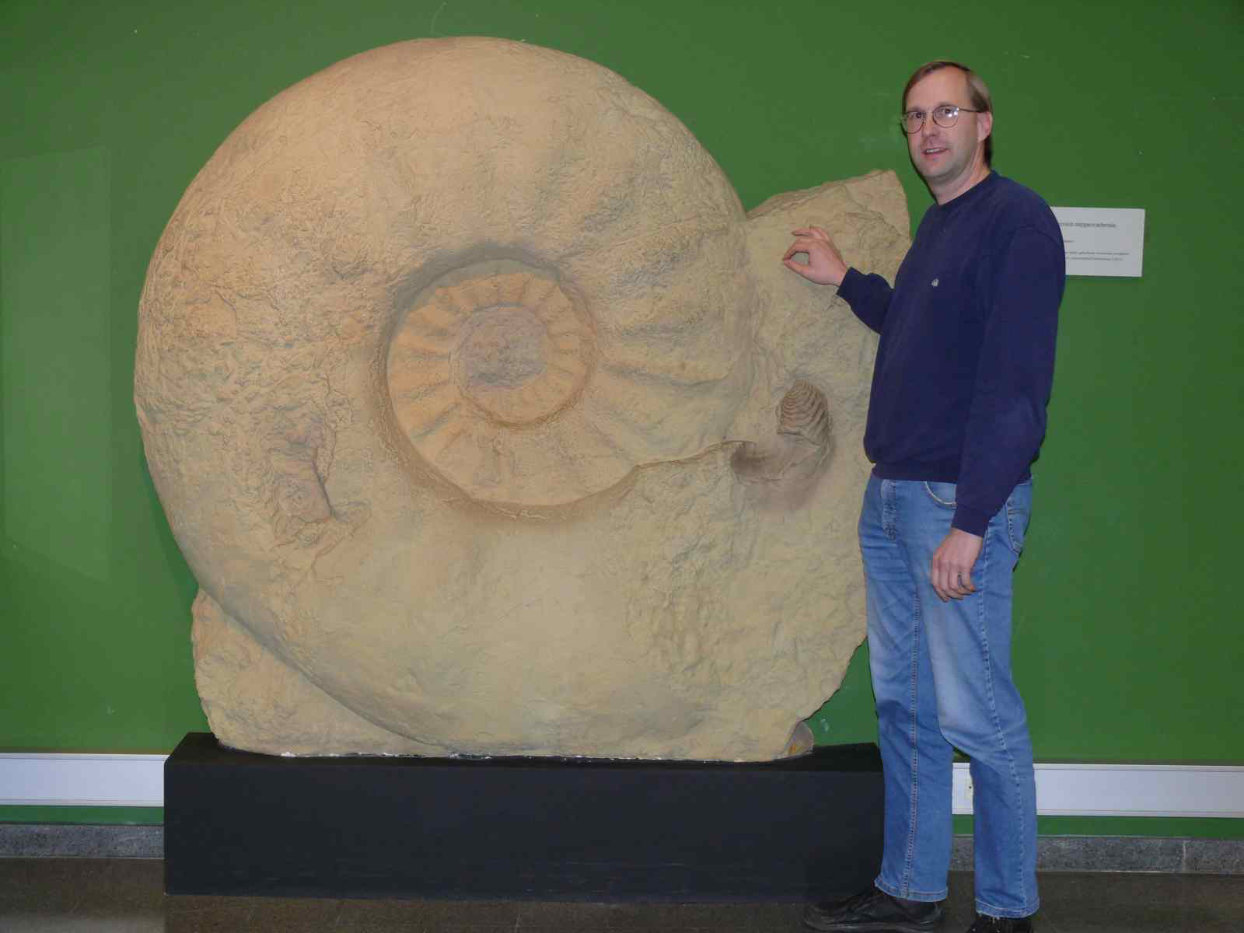
Prehistoric levels of CO2 in the oceans made 2 m diameter ammonites possible:
Attribution: Gunnar Ries, CC BY-SA 3.0 , via Wikimedia Commons
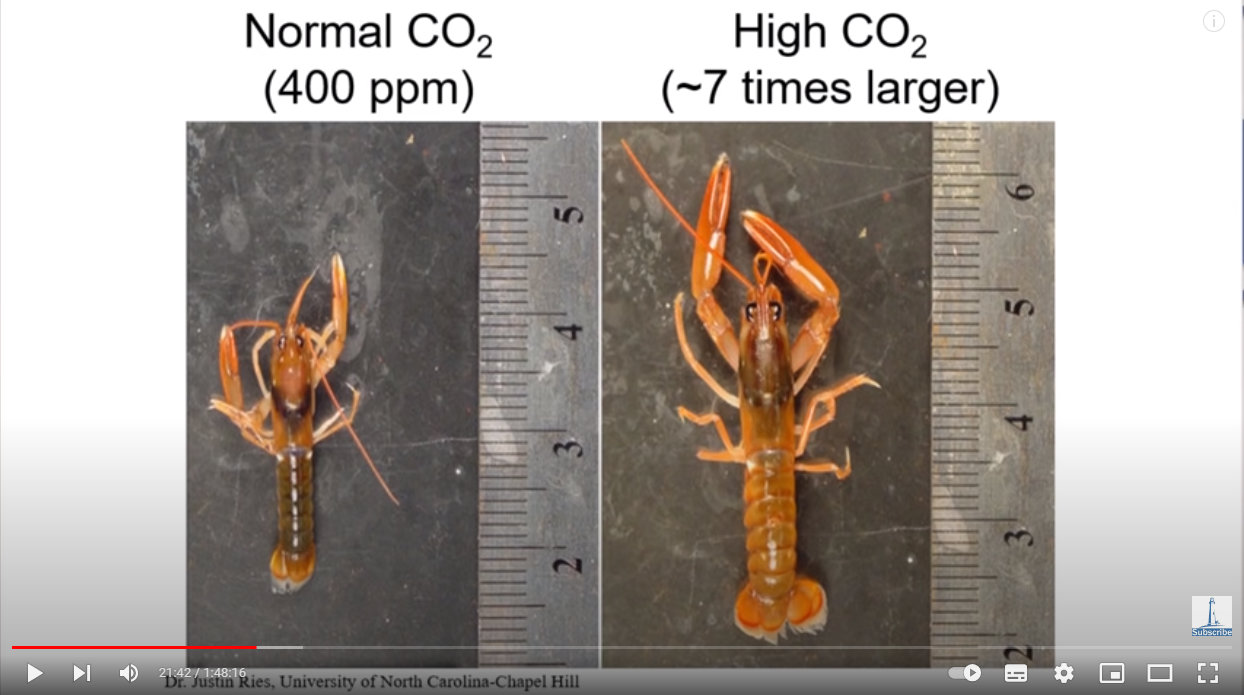
While today lobsters and crabs respond favourably to increased CO2 in seawater.:
Source: https://youtu.be/1zrejG-WI3U?t=1302
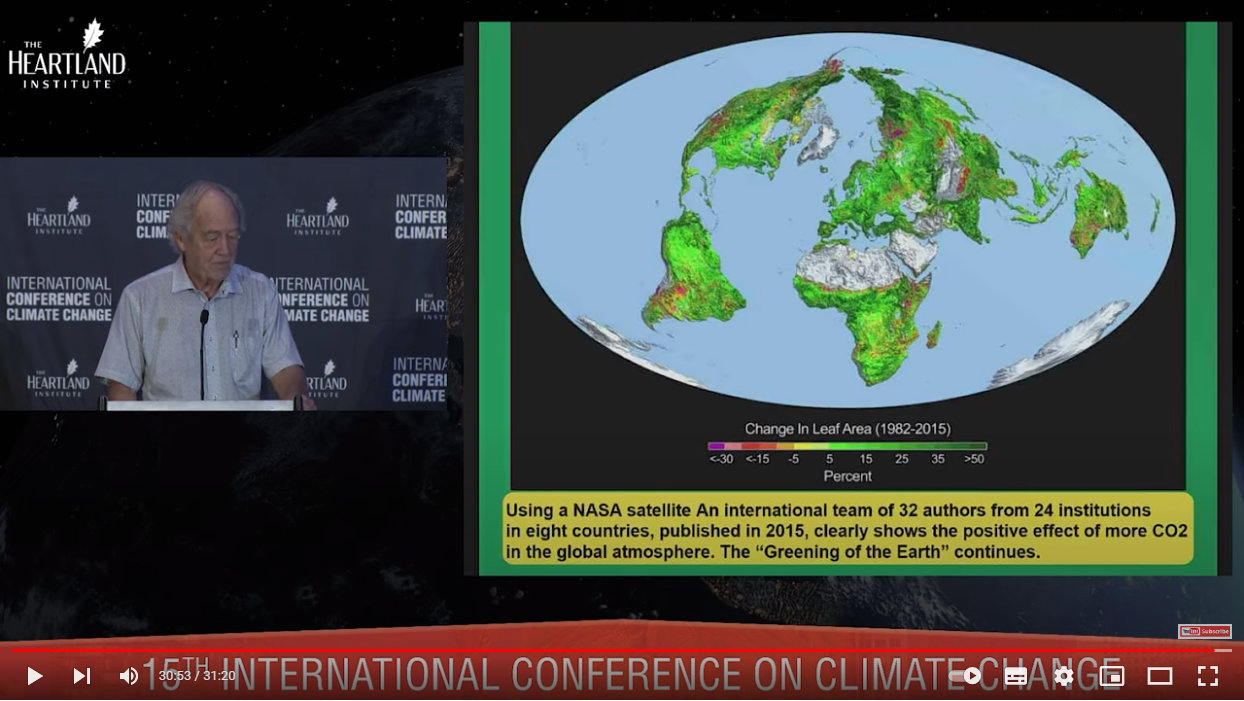
NASA itself has shown that the Earth is greening as CO2 levels rise from near-extinction levels:
Source: https://youtu.be/GH8v5aCbZBs?t=1853
In Summary: CO2 is a nutrient. Not a pollutant, but beneficial to life, on land and in sea. It follows that the more CO2 available, the more the biosphere will respond favourably. CO2 cannot soar to ’dangerous levels’ (which are never defined) so long as cyanobacteria, phytoplankton, algae, plants, molluscs, and crustaceans exist to readily avail themselves of it.
Anyone in favour of — and in a position to enforce — "net zero carbon” is a danger to all life on Earth. And no, this is not hyperbole.
Part 2: Our Climate is Predominantly Driven by the Sun
The Sun is 330, 000 times the mass of Earth, is almost 99.9% of the mass of the Solar System, and converts 4 million tonnes of matter into heat and light every second. Standing outside on a sunny day as clouds roll in to cover the Sun and drop temperatures noticeably is enough to know just how much influence this powerful body has on Earth’s temperatures. And knowing that the four seasons relate to the tilt of the Earth with respect to the Sun is enough to know just how much influence this powerful body has on Earth’s climate. (Climates more correctly.)
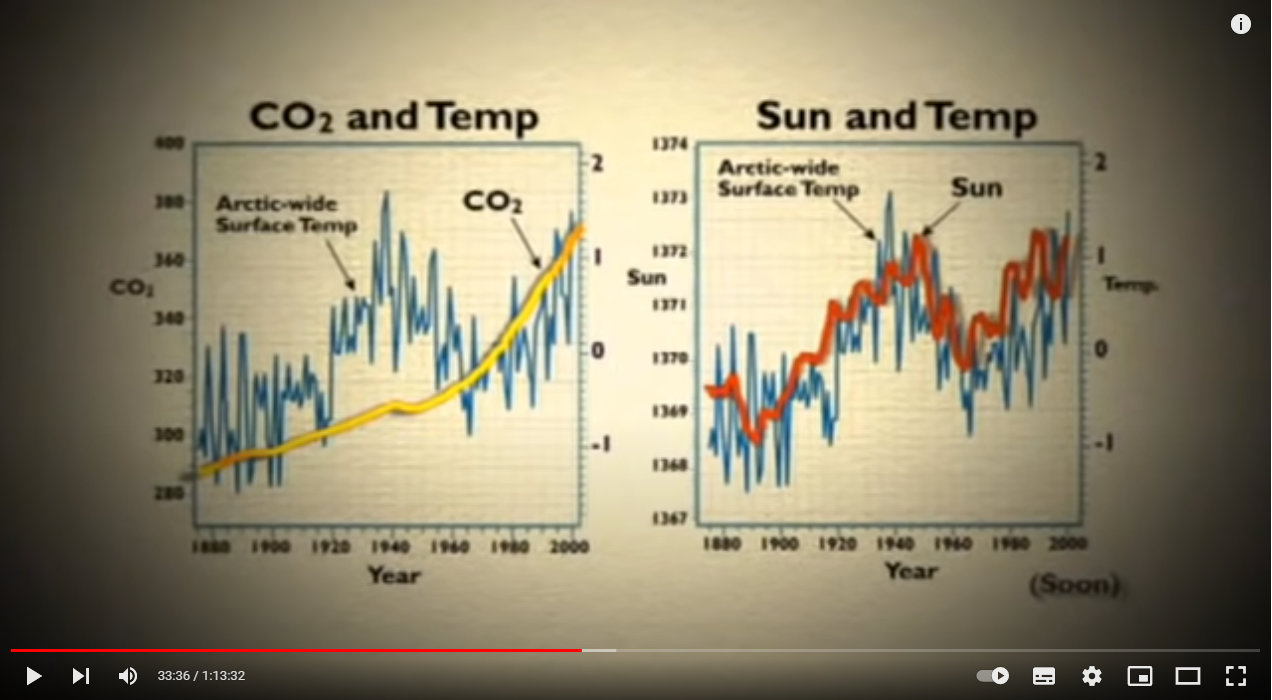
There is not one iota of evidence that links CO2 to rising temperatures — when honest lengths of time are considered — but there is plenty linking temperatures to solar activity:
Source: https://youtu.be/BY-gRFSaP7o?t=2016
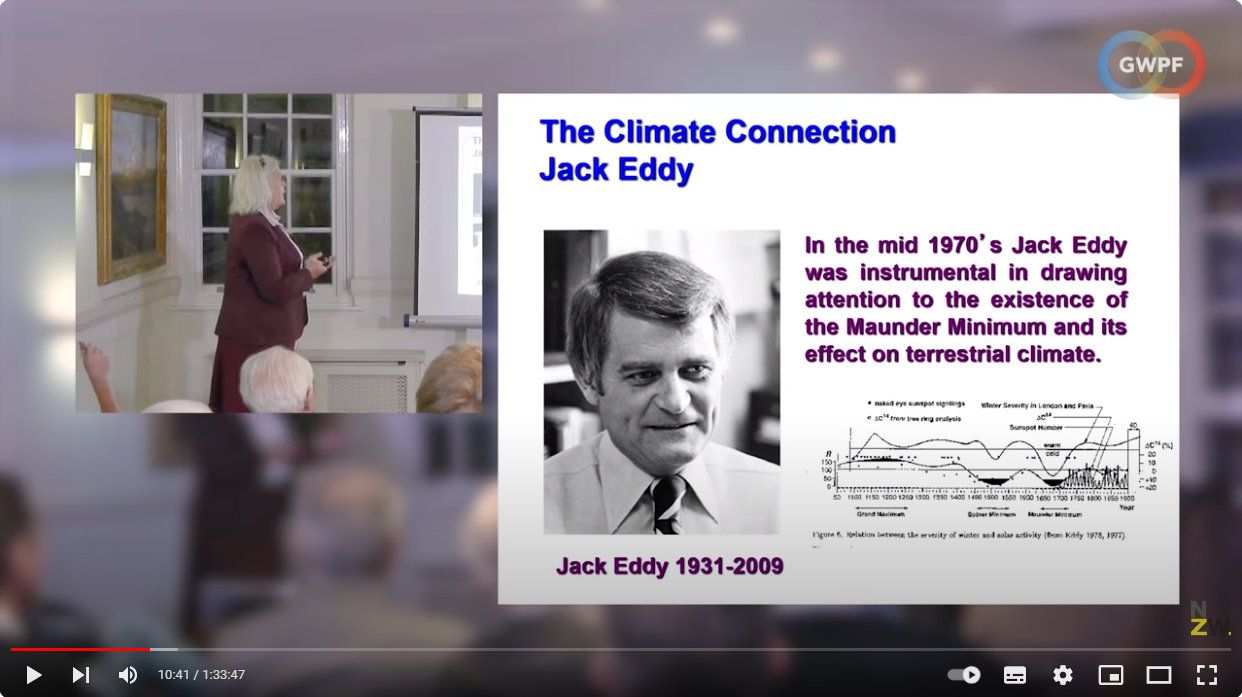
Jack Eddy was the first to make the connection between sunspot activity and temperature on Earth:
Source: https://youtu.be/M_yqIj38UmY?t=640
and others, including Rhodes Fairbridge, Valentina Zharkova, and several more, have collectively shown how the Sun rotating around a Solar System barycentre causes these sunspots to increase and decrease in intensity in a very predictable and cyclical manner.
In Summary: Astrophysics and the interplay of the Sun and Earth do far more to shape Earth’s climate than a trace gas of a mere 0.04% atmospheric concentration. The Sun similarly affects the climate of other planets too, and it’s worth mentioning that when Earth’s polar ice was melting, so too was Mars’.
On Climate Scientist Climate Activist Speak
Have you ever really listened to a climate activist? They could be bad actors in a dramatic play. The ‘danger’ is always “a crisis", always stated vaguely, and is always ten years away. They speak in weasel words.
Here’s but one example, complete with scary photo for added drama:
Posted Mon 9 Aug 2021 at 6:01pm, updated Tue 10 Aug 2021 at 7:28am
The Earth could be just 10 years from heating by more than 1.5 degrees Celsius — a threshold beyond which even more serious and frequent fires, droughts, floods and cyclones are expected to wreak havoc on humanity.
This isn’t science, it’s propaganda and fearmongering. There is not one thing of substance stated. It is also an example of the Appeal to Emotion Fallacy (in Latin, Argumentum ad passiones).
Let’s pick these words apart.
“Could be"? So…it might not be? And if it “could be” ten years, could it just as likely to be five or fifteen years, or never? Why is a range like ‘7 to 12 years’ never stated? Why single, round numbers all the time?
And at how much hotter than a 1.5 °C Celsius increase is havoc wreaked? They never say, but it has to be small, otherwise they’d state a higher number to begin with. And this heating by some tiny amount is “expected to” cause fires, droughts, floods and cyclones? Really? HOW?! Give us reasons and details, please! We crave these! Then we can look into your theories and examine your data ourselves, and shut up once and for all if we’re wrong.
Science is data and debate, not assertions and emotion.
I have no doubt that if Scotland during the Mediaeval Warm Period had been plagued by fires, droughts, floods and cyclones during that time, that the climate activists would have made sure we knew about it. There would have been as much art depicting those events as there were of the later ice fairs too.
A link to the cited report is glaringly absent too. If the journalistic standards of the above paragraph are anything to go by, I wouldn’t be at all surprised if the authors had not even read the report, but copy-pasted a press release.
Climate activists use weasel words to imply that global warming is “out of control". They probably don’t believe their own words anyway, as these “crises” have forever been ten years away, for decades.
That they can’t provide definitive evidence but instead must resort to cheating with poorly-placed thermometers, heavily-truncated graphs, falsification of data to make well-documented periods disappear, and appeals to emotion is all we need to know.
On Climate Activists’ Agenda
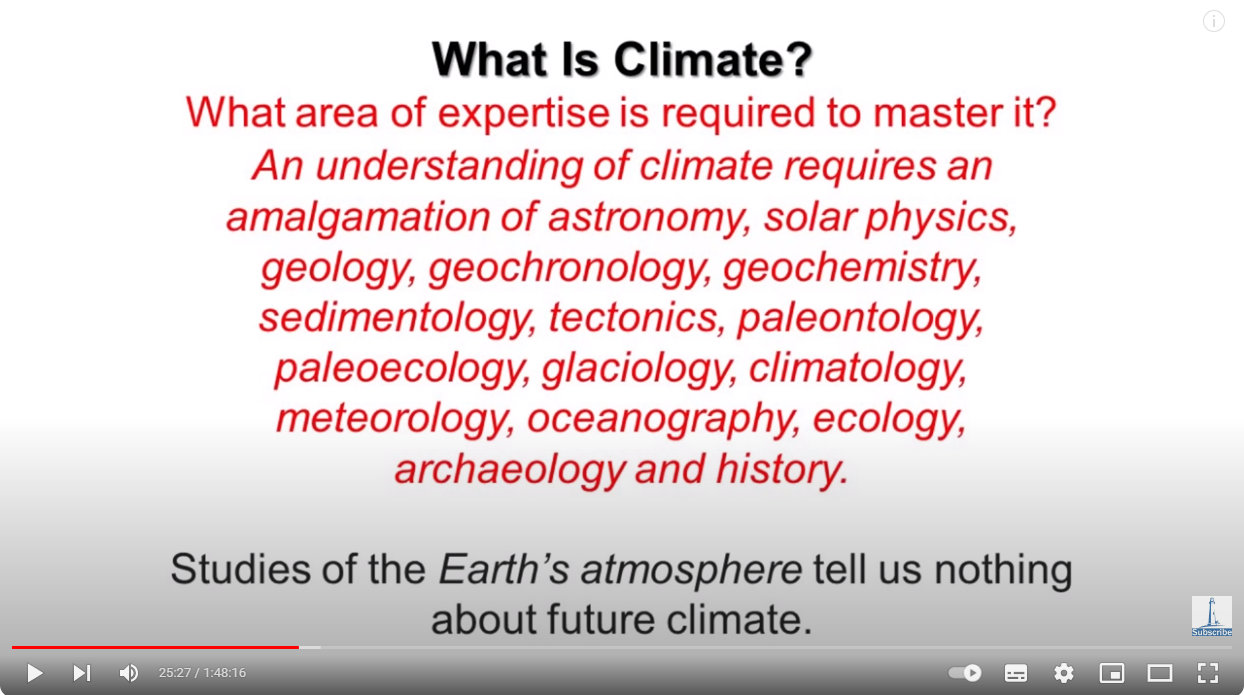
Revisting Willie Soon’s slide:
Source: https://youtu.be/1zrejG-WI3U?t=1527
The Earth’s atmosphere tells us nothing about future climate(s). Not one thing.
For example, the earth’s early atmosphere in 4.5 billion years BC was 97% CO2. The rest was nitrogen — there was no atmospheric oxygen. There was also no life and the climate then would have been unbearable and unliveable from our point of view.
How could observing that one value (CO2 concentration) at that time possibly enable an observer at that time to conclude that atmospheric CO2 would be but 0.04% in 2023 AD? And with 21% oxygen, abundant life, and four seasons?
How can an activist, today, possibly claim a temperature rise of X °C in Y years ,based on just one value (CO2 concentration), today?
And let’s be honest — we know the activists aren’t — if CO2 really were the sole reason, then the solution is incredibly simple. Anyone can do it and it doesn’t need taxpayer dollars, ridiculous ‘carbon trading credits’, corrupt ’scientists’, government shills, or grifters to implement. Just…plant more trees!
One Final Note
About the Author
BSc(Hons), U.Syd. - double major in biochemistry and microbiology, with honours in microbiology
PhD, U.Syd - soil microbiology
Stumbled into IT and publishing of all things.
Discovered jujube trees and realised that perhaps I should have been an agronomist...
So I combined all the above passions and interests into this website and its blog and manuals, on which I write about botany, soil chemistry, soil microbiology and biochemistry - and yes, jujubes too!
Please help me buy a plant if you found this article interesting or useful!