My Take on the Carbon Dioxide Narrative: Part 2: The Biosphere
Introduction
There are four major spheres of Earth: the atmosphere (air), the hydrosphere (water), the lithosphere (land), and the biosphere (life). The vast bulk of ‘climate change’ science concerns fields within the first three, which are all abiotic. Fields such as atmospheric chemistry, atmospheric physics, meteorology, climatology and oceanography.
Whenever the biosphere is mentioned by mainstream media and other laypeople in the same breath as ‘climate change’, it is usually in the context of all life on Earth is headed for annihilation as carbon dioxide (CO2) levels soar to catastrophic levels (whatever those never-defined levels may be). Which is quite incredible really, considering how vital a gas CO2 is to all living organisms, being the origin of all organic carbon on Earth.
What is forgotten (or not even understood) is that there is a carbon cycle, which has been here for as long as there has been life. CO2 converts to organic carbon, and organic carbon converts to CO2, over and over and over again.
Without autotrophs fixing the carbon in CO2 (whether from air or deep underwater vents), there simply would not be any life on Earth, of any description, in any region. And all life would ultimately cease without the heterotrophs continuously cycling that carbon through other life and back into the air or water for autotrophs to make use of.
The CO2 humans additionally produce is a fraction of this, and comes from organic carbon which had been locked away aeons ago until now anyway. We are simply returning to the atmosphere some of the carbon that was originally there, and in so doing, making this carbon available to autotrophs for the first time in millions of years.
That the role of the biosphere in its interactions with the other three spheres is summarily ignored when it comes to ‘climate change’ makes me very suspicious as to the reasons. Such as not fitting the narrative, as medical entomologist Professor Paul Reiter discovered.
This is the post I would have liked to have read myself when first looking into this subject — the one that acknowledges that a biosphere does exist and will respond to CO2 levels just as it responds to anything else, whether ‘the thing’ goes up, down or continues sideways.
Very Simply
Just as there are natural checks and balances in play between prey and predators, so too are there natural checks and balances concerning nutrients — and CO2 is a nutrient.
For every 10,000 molecules in the atmosphere, four are CO2 (400 ppm, or 0.04%). Maybe in a few decades’ time, there may be five in every 10,000 (500 ppm, or 0.05%). Do people really toss and turn through the night over this?
Will the autotrophs — plants, algae, and the photosynthesising and some chemotrophic bacteria — sit passively by as four CO2 molecules (may or may not) increase to five? Or will they opportunistically grab those additional pieces of nutrition instead?
And if they do grab those extra morsels, then surely they would produce a little more carbohydrate and grow a little bit better, and be a little bit more nutritious to the herbivores? And those herbivores in turn become a little more nutritious to carnivores?
And so a new equilibrium would establish itself. NASA data shows the Earth greening significantly as CO2 levels have risen from around 275 ppm (0.0275%) in the early 1600s, All this from a change from not quite three molecules of CO2 per 10,000 atmospheric molecules to four today. How much greener could it be with five, six, more CO2 molecules in every 10,000?
Plant growth can increase by up to 50% at 1,000 ppm CO2 (ten molecules per 10,000), but plant death occurs at 150 ppm CO2 (less than two molecules per 10,000). CO2 levels have been on a continual decline for millions of years, and C4 and CAM plants were evolving 30 million years ago to cope with this.
The Carbon Cycle
Every nutritional element on the planet is recycled over and over, and over again. These are neither created nor destroyed, but forever moving through the −spheres in one form or another. And carbon is no different. The biosphere moves more carbon as CO2 from the land (lithosphere) and sea (hydrosphere) to the air (atmosphere) than we ever could, via the cellular respiration of countless organisms of all shapes and sizes. And that CO2 then moves from the air back to the sea and land via the carbon-fixers. CO2 also cycles within the lithosphere and hydrosphere.
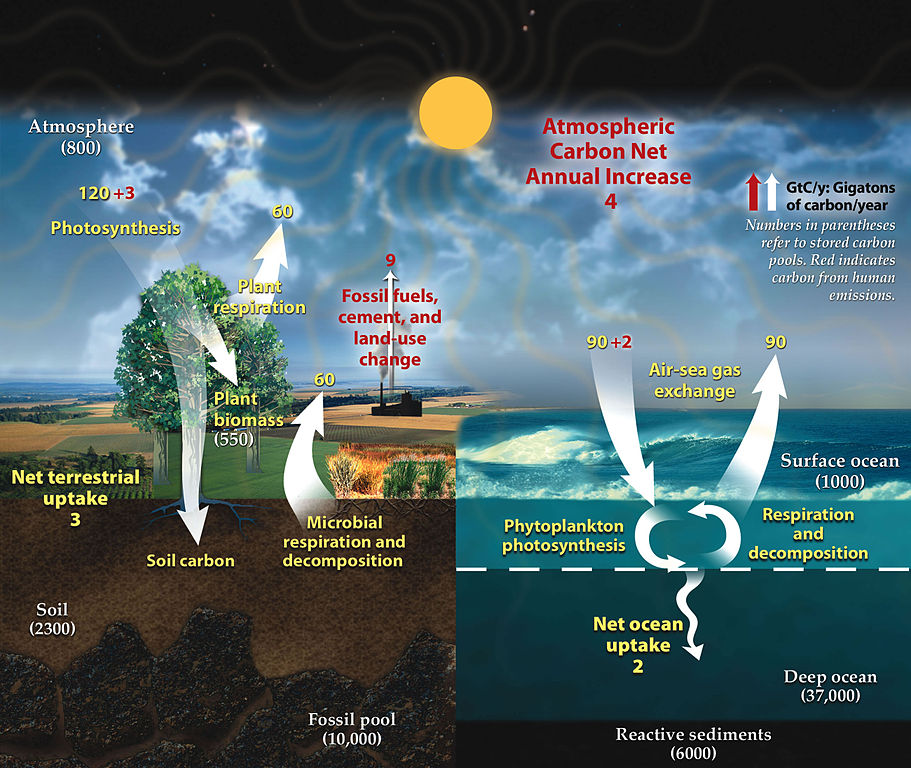
Attribution: Diagram adapted from U.S. DOE, Biological and Environmental Research Information System., Public domain, via Wikimedia Commons
The Biosphere and CO2
I will draw in places on this talk by Dr Patrick Moore (co-founder of Greenpeace), not only because it is very recent (16th March 2023), but it also has some great content I can take screenshots of! The screenshots are direct links to the timestamp they were taken at, for people to view more detail if they wish. Please note that these may be out of order below compared to the original presentation where it suits my discussion better, as I elaborate further on some of his.
CO2 and Temperature Fluctuations Over Half a Billion Years
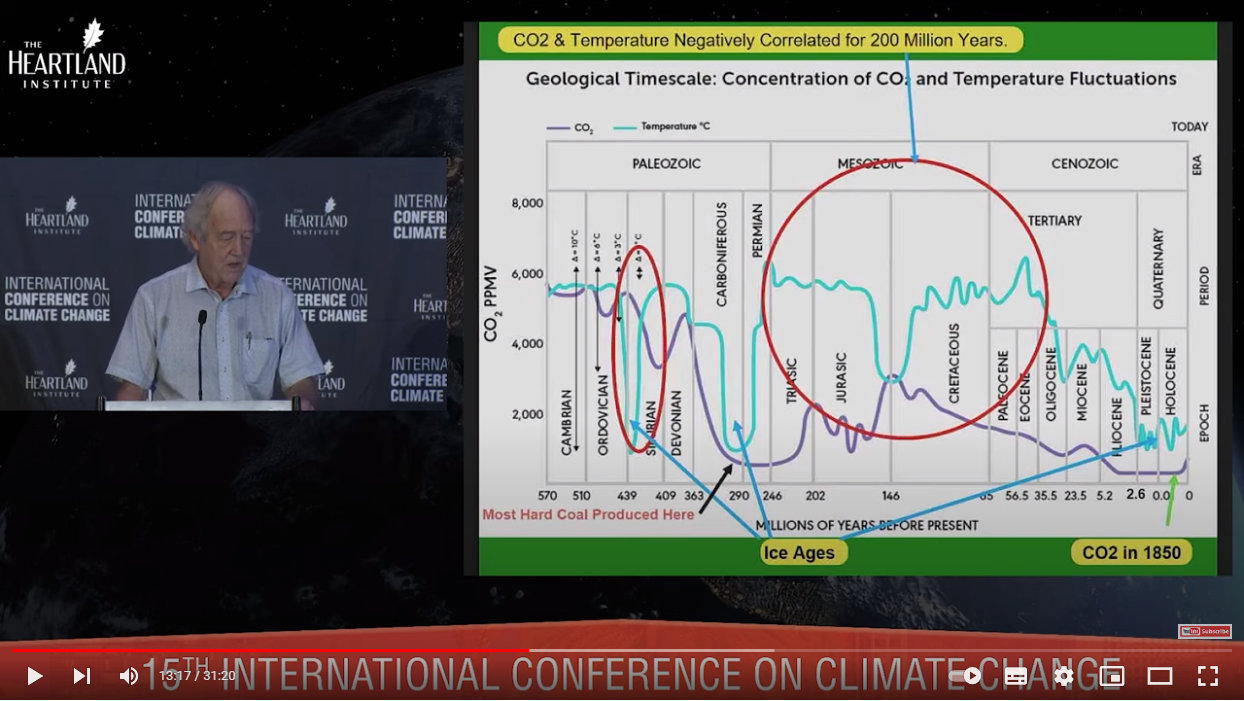
Please take the time to study the following graph carefully. The geological periods here, from the Cambrian Period around 540 million years ago to today’s Holocene Epoch, cover all multicellular life — prior to the Cambrian the vast majority of life was unicellular, which first appeared some 3.5 billion years ago. So dramatic was the change from single-celled to multi-celled, that this is also known as the Cambrian explosion or Biological Big Bang.
All modern animal phyla, including our own (Chordata) originate from this time. Thus this graph represents the time on Earth during which the biosphere is at its most diverse and contains the most biomass.
Source: https://youtu.be/GH8v5aCbZBs?t=797
The large red circle shows a 200 million year period in which CO2 (purple line) is negatively correlated with temperature (cyan line). More fascinating still is that during this time the temperature is significantly at its lowest when CO2 is at its highest.
Incidentally, the circle spans all of the Mesozoic Era, which is known as the age of the dinosaurs. (Birds are the only dinosaur lineage still here.) Ancestors of the world’s tallest trees such as the Sequoioideae and Araucariaceae date to the Mesozoic Era. The following Cenozoic Era, partially included in the circle, marks the emerging dominance of flowering plants and mammals.
Thus the time of mega flora and fauna coincided with the highest temperatures ever experienced by multicellular life, and with CO2 levels anywhere from two to eight times today’s levels.
Also interesting to note is that we are currently in an age of temperatures similar to those of the three ice ages shown. There is no ‘warming’ going on right now when considered in the context of geological time.
One last note about this graph concerns the massive drop in CO2 from about 5,000 ppm at the end of the Devonian Period right through the Carboniferous Period to about 500 ppm (today’s level), before climbing again. This is no coincidence. Carboniferous means ‘coal-bearing’, and this is the period in which vast coal deposits were laid down.
Plants at the beginning of the Carboniferous around 360 million years ago had developed lignin, a complex material making up plant cell walls and which give them rigidity and strength. These properties enabled wood and bark, and thus trees to evolve. As it would be another 60 million years before microbes evolved lignase enzymes to degrade lignin, fallen trees would accumulate on top of each other, compress under the weight, and be preserved within their environments of mud and wetlands. Time, temperature and pressure would eventually convert them to coal and peat — so much so, that 90% of all coal deposits formed during the Carboniferous and Permian periods, which represent just 2% of all geological time.
The precipitous drop in CO2 through the Carboniferous especially was due to earth’s first tall trees fixing the carbon they needed to fuel their growth and development. This drop also coincided with a precipitous drop in temperature during an ice age, and CO2 levels wouldn’t rise again until well after temperatures rose towards the end of the Permian.
Correlation is Not Causation!
“Global warming”’s sole premise is that rising CO2 levels cause rising temperatures. This actually isn’t true, as evidenced by that inconvenient 200 million year slice of prehistory above and elsewhere.
But even if CO2 levels were in lockstep with temperatures, this does not mean that one causes the other. To think so is a logical fallacy, known as the False Cause Fallacy, or the Questionable-cause Logical Fallacy. In Latin, cum hoc ergo propter hoc (’with this, therefore because of this’).
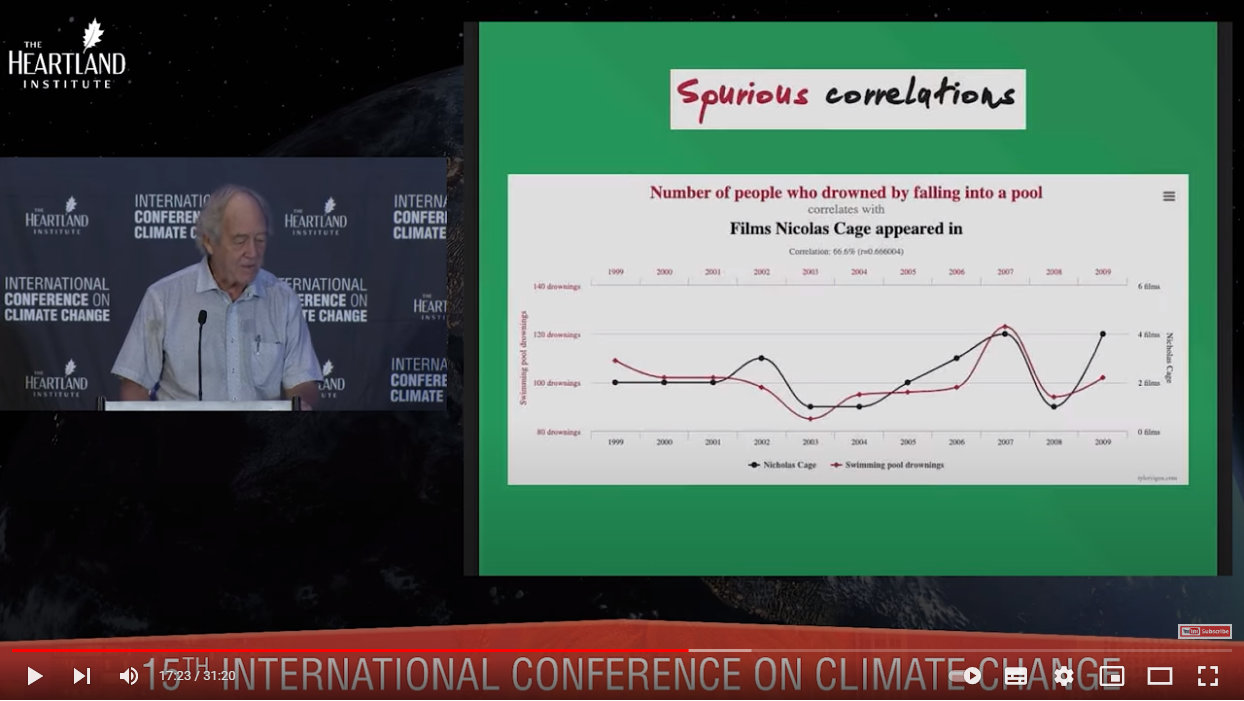
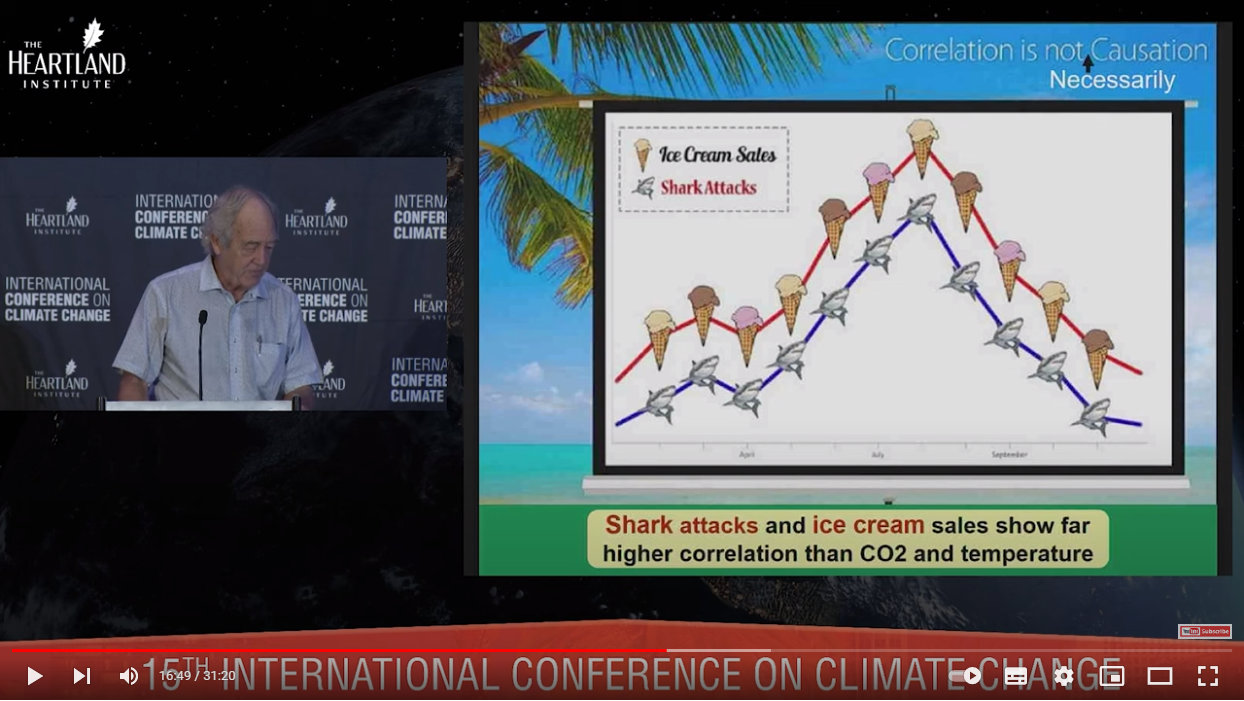
Observed correlations could well be a simple coincidence, or could well be influenced by a third, unseen factor.
To illustrate the first concept, Dr Moore shared this graph from the brilliant site Spurious Correlations (truly worth a visit for the giggles!):
Source: https://youtu.be/GH8v5aCbZBs?t=1043
Really, there is nothing more to say!
And to illustrate the second, he shared this somewhat tongue-in-cheek graph:
Source: https://youtu.be/GH8v5aCbZBs?t=1009
The unseen factor of course being summer and warm weather drawing people to the beaches where they purchase ice-cream and enter shark-infested waters.
The Locking Away of 100 Quadrillion Tons* of Organic Carbon From Inorganic CO2
*Tons, tonnes, at these numbers they’re pretty much synonymous!
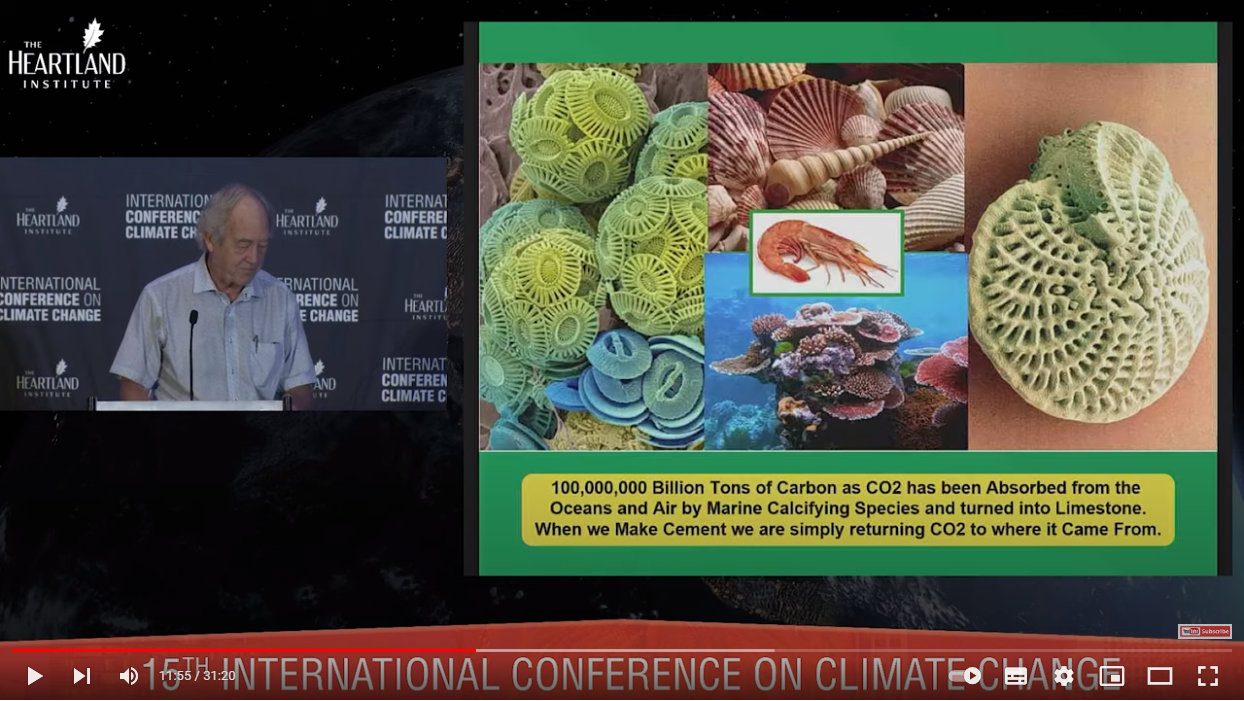
Source: https://youtu.be/GH8v5aCbZBs?t=715
The first multicellular life was soft and jellyfish-like, and lived only in the watery environments of the early Cambrian Period. Partway into the Cambrian, around 500 million years ago, the first shell evolved, and this natural armour-plating proved an immediate and huge evolutionary advantage.
These shells were made from calcium carbonate (CaCO3), which formed from dissolved calcium ions (Ca2+) and carbonate ions (CO32-) in the oceans.
The reaction is:
Ca2+ + CO32- → CaCO3
The carbonate ions themselves originated from dissolved CO2 in the oceans.
Dissolved CO2 reacts with water (H2O) to produce the weak acid carbonic acid (H2CO3). This molecule deprotonates (loses a proton, the H+ ion) to form hydrogencarbonate (also called bicarbonate, HCO3-) when in water. Hydrogencarbonate in turn deprotonates to the carbonate ion (CO32-), and all three molecules protonate and deprotonate to establish an equilibrium in water:
H2CO3 + 2H2O ⇌ HCO3- + H3O+ + H2O ⇌ CO32- + 2H3O+
Chemical equilibrium is established when a reaction occurs both forward and in reverse, and when products and reactants do not change their respective concentrations over time. Both the forward and reverse reactions occur at the same rate and there does not appear to be any change in the properties of the system.
A change to the concentration of a reactant or product will cause the equilibrium to shift either left or right until a new balance and equilibrium results.
If conditions change such that all reactants are fully consumed, then the equilibrium is said to shift fully to the right.
If conditions change such that reactants don’t react (no products form), then the shift is said to be fully to the left.
Let’s add CO2 and water to the beginning of the above equilibrium:
CO2 + 3H2O ⇌ H2CO3 + 2H2O ⇌ HCO3- + H3O+ + H2O ⇌ CO32- + 2H3O+
And let’s refer back to this other from above:
Ca2+ + CO32- → CaCO3
Does it make sense that if animals which are making calcium carbonate shells are becoming increasingly successful, that evolution will drive more and more species to have such shells?
Does it also make sense for these species to require more and more Ca2+ and CO32- ions to be available as their populations increase?
Can you see that if the carbonate ion (CO32-) products on the right of the first equation go on to react with calcium ions to form calcium carbonate in the second reaction, that they have been removed from that first equation?
Can you see that a removal of this product from the first equation shifts this equilibrium to the right, as there is now less carbonate to react in the reverse reaction?
Can you see that for more carbonate ions (CO32-) to form on the right, for species to avail themselves of, that more CO2 must enter the water so as to drive the equation to the right?
Can you see how the evolution of calcium carbonate shells could be responsible for the permanent removal of tonnes and tonnes of CO2 from the atmosphere?
And did you know that vast chalk, limestone, dolomite and marble deposits present today are the fossilised remains of animals and plants which incorporated carbonate ions into their physiology in some way?
Chalk deposits, as in the White Cliffs of Dover, are the remains of single-celled phytoplankton called coccolithosphores. That’s a lot of coccolithosphores! And so pretty — what you see in the upper left of the slide are their coccosphere exoskeletons made of calcium carbonate scales.
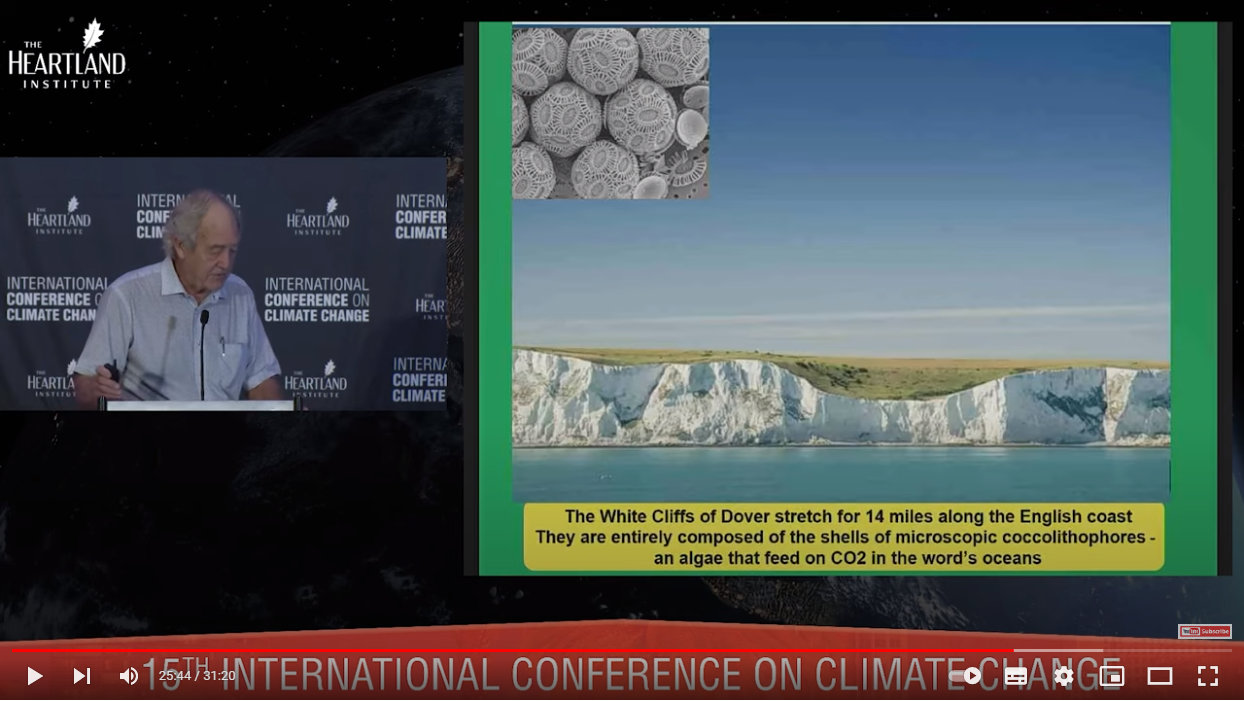
Source: https://youtu.be/GH8v5aCbZBs?t=1544
Limestone and dolomite can form non-biologically as well as biologically. If the latter, these deposits originate from corals and shells.
Marble forms from limestone and dolomite deposits which have been subjected to high pressures and temperatures, thus much marble too has a biological origin.
One last point to end this section on — not mentioned in the video but which has been raised by Dr Moore elsewhere — is my particular favourite: the 2 m diameter calcium carbonate shell of the ammonite Parapuzosia seppenradensis:
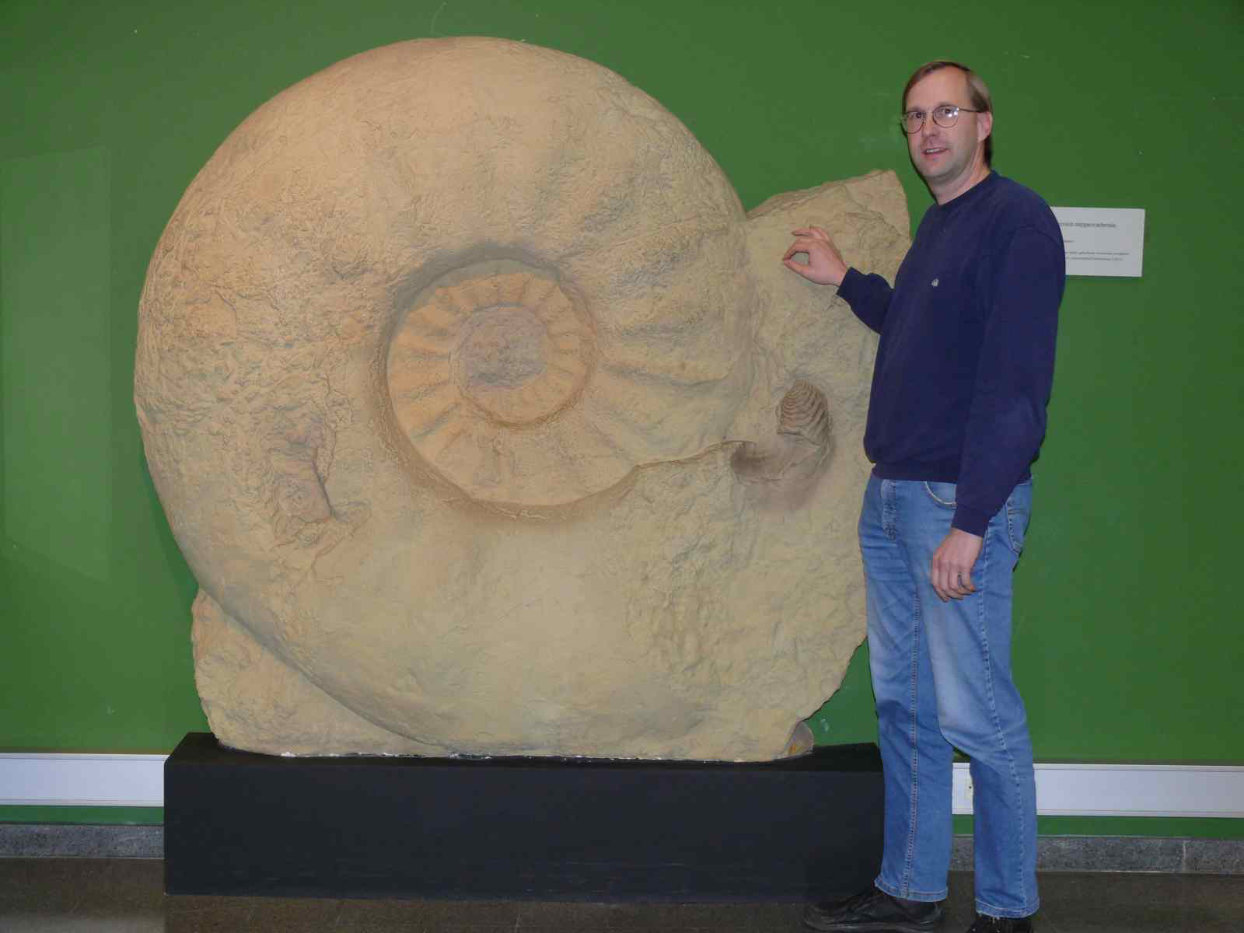
Attribution: Gunnar Ries, CC BY-SA 3.0 , via Wikimedia Commons
Ammonites of all sizes were prevalent from 400 to 66 million years ago, and the largest known species, Parapuzosia seppenradensis, dates to about 80 million years ago. This was during the Late Cretaceous Period when all the famous dinosaurs were at their peak and when CO2 levels began a nonstop downwards trend right through the entire following Cenozoic Era from about 2,000 ppm to today’s 500 ppm.
A mass extinction event occurred around 66 million years ago, at the boundary of the Mesozoic and Cenozoic Eras — that event is what marks the boundary — which wiped out those ammonites, dinosaurs, and many many other plant and animal species in a relatively short period of time. How much carbon was locked away in fossilised shells, bones, and wood; or trapped in soils and peat bogs as partially decayed plant and animal tissue from that event?
CO2 and Temperature Fluctuations Over Millions of Years
This graph shows temperatures since that mass extinction event 66 million years ago:
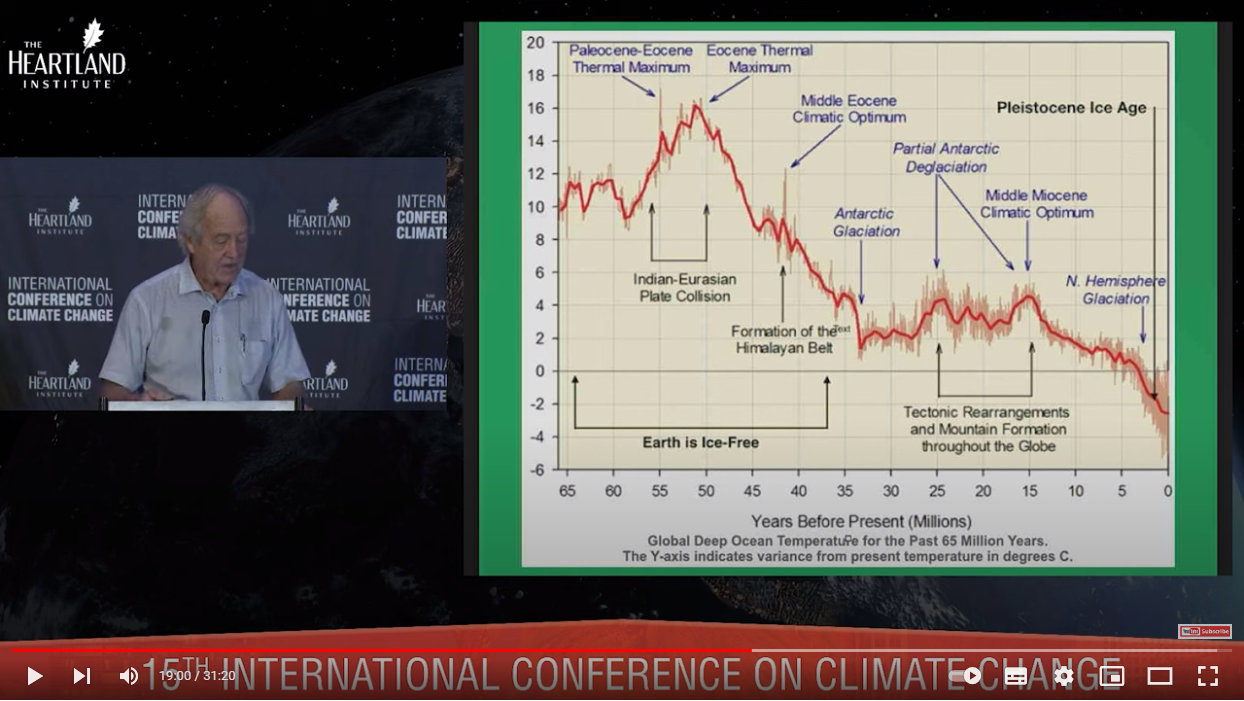
Source: https://youtu.be/GH8v5aCbZBs?t=1140
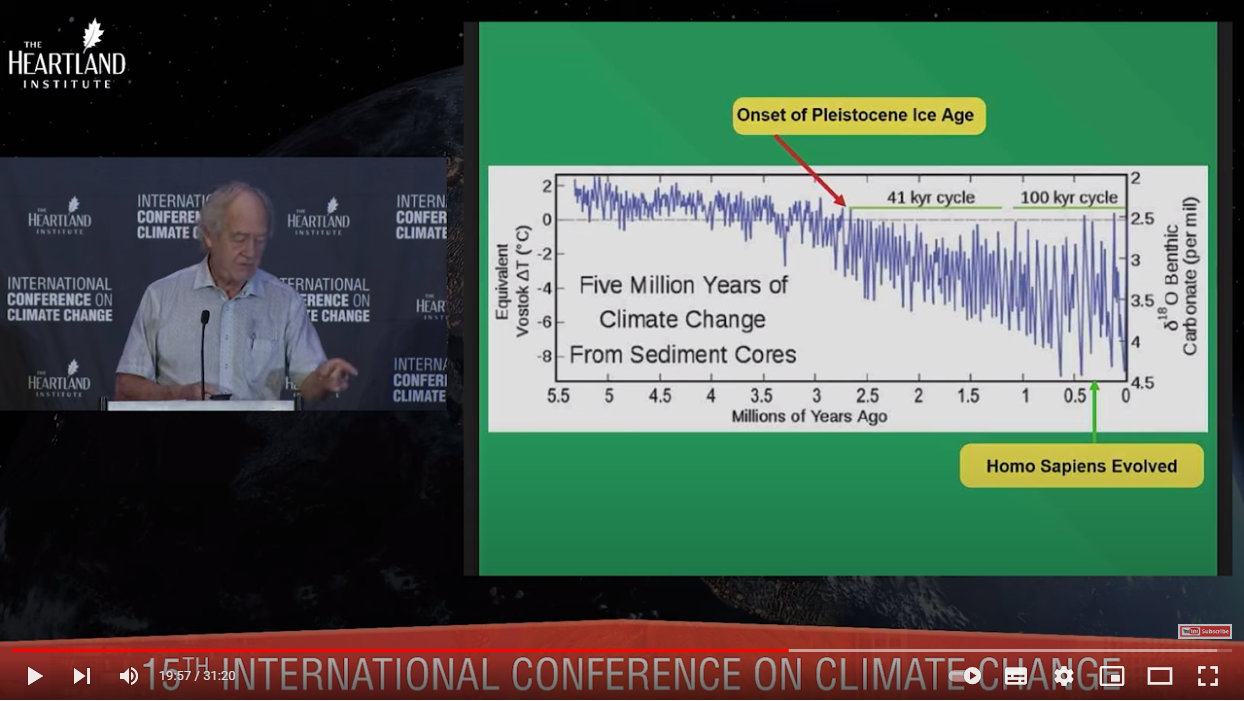
The Earth has not been ice-free since the Oligocene Epoch 35 million years ago — Antarctica was forested prior to that! The Earth has never been colder and had less atmospheric CO2 than during the most recent ice age in the Pleistocene Epoch. The Pleistocene Epoch is the last ice age, and is even called The Ice Age. This last ice age began 2.5 million years ago and ended just 11, 700 years ago.
For context, the Homo genus first appeared 2.8 million years ago, and we, Homo sapiens, first appeared just 300, 000 years ago.
This graph focuses on the last five million years, and shows where the Ice Age begins and when Homo sapiens first appeared:
Source: https://youtu.be/GH8v5aCbZBs?t=1194
It just keeps getting colder…
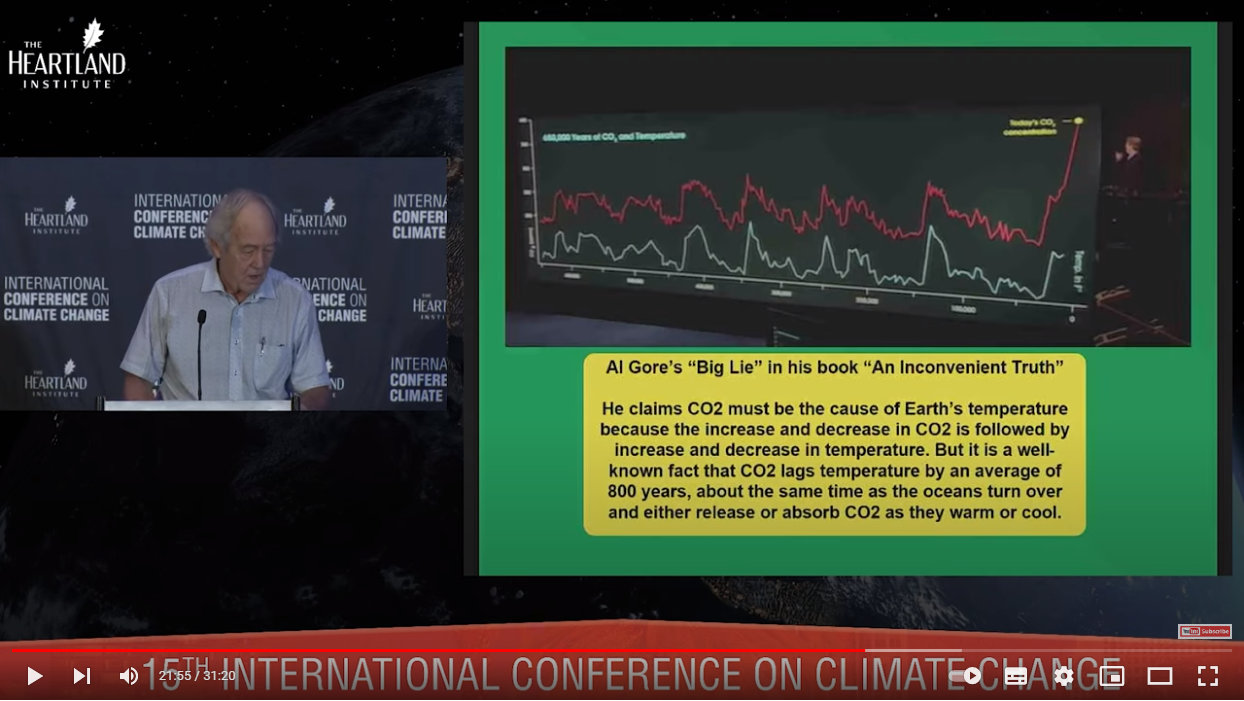
This famous (infamous) and very deceptive screenshot was mentioned earlier here:
Source: https://youtu.be/GH8v5aCbZBs?t=1315
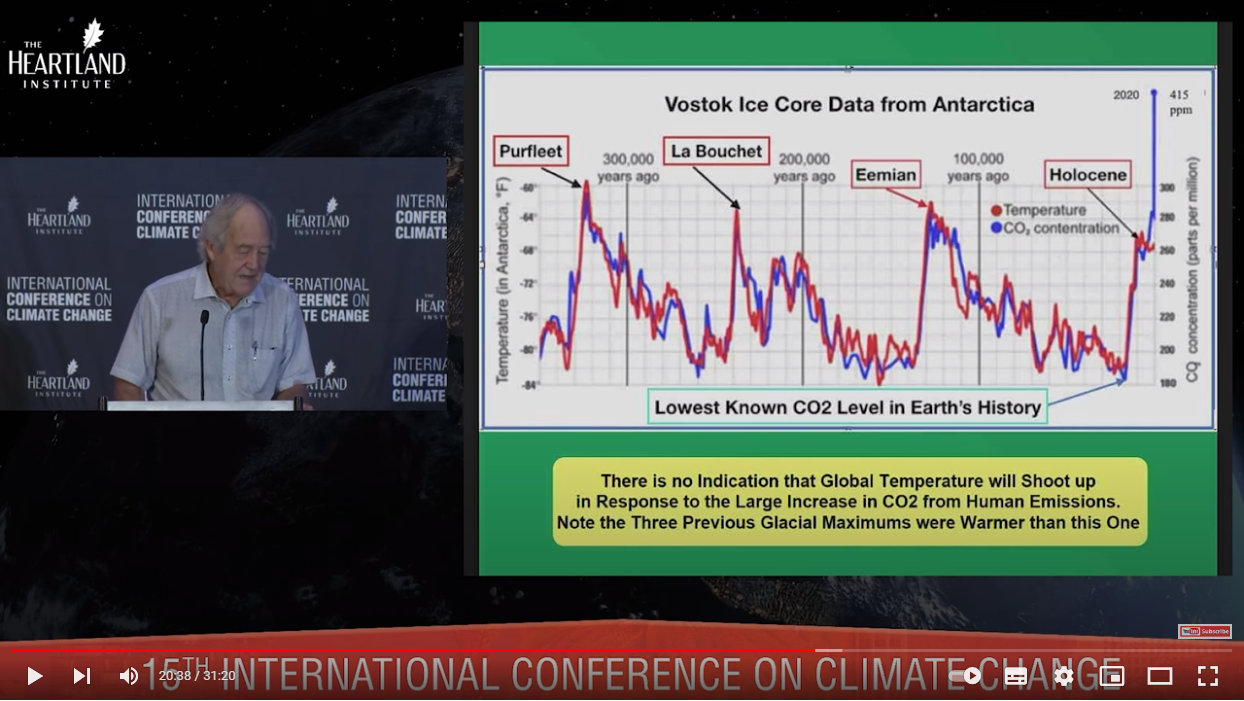
Deceptive, because it is well-known that CO2 lags temperature by 800 years. So much data have been compressed into these graphs, and the two graphs deliberately separated, that this lag is not apparent unless you plot much shorter time-frames on longer x-axes.
Compare, for example, with these still-compressed, but superimposed graphs, where you can just make this lag out if you squint and take the time to look carefully for where the red temperature line is ahead of the blue CO2 line in most cases. Where this isn’t the case just reinforces how poor the relationship between the two has always been. (Spoiler for the next post: the invisible factor is sunspot activity.)
Source: https://youtu.be/GH8v5aCbZBs?t=1235
And one reason why CO2 lags temperature is because rising temperatures heat the oceans, which release dissolved CO2 back into the atmosphere. Cooling temperatures cause the oceans to reabsorb CO2. Try this for yourself at home! Take a glass of cold water out of the fridge and place on the counter. As the water warms you will see CO2-containing air-bubbles form at the surface as they exit the water and enter the air.
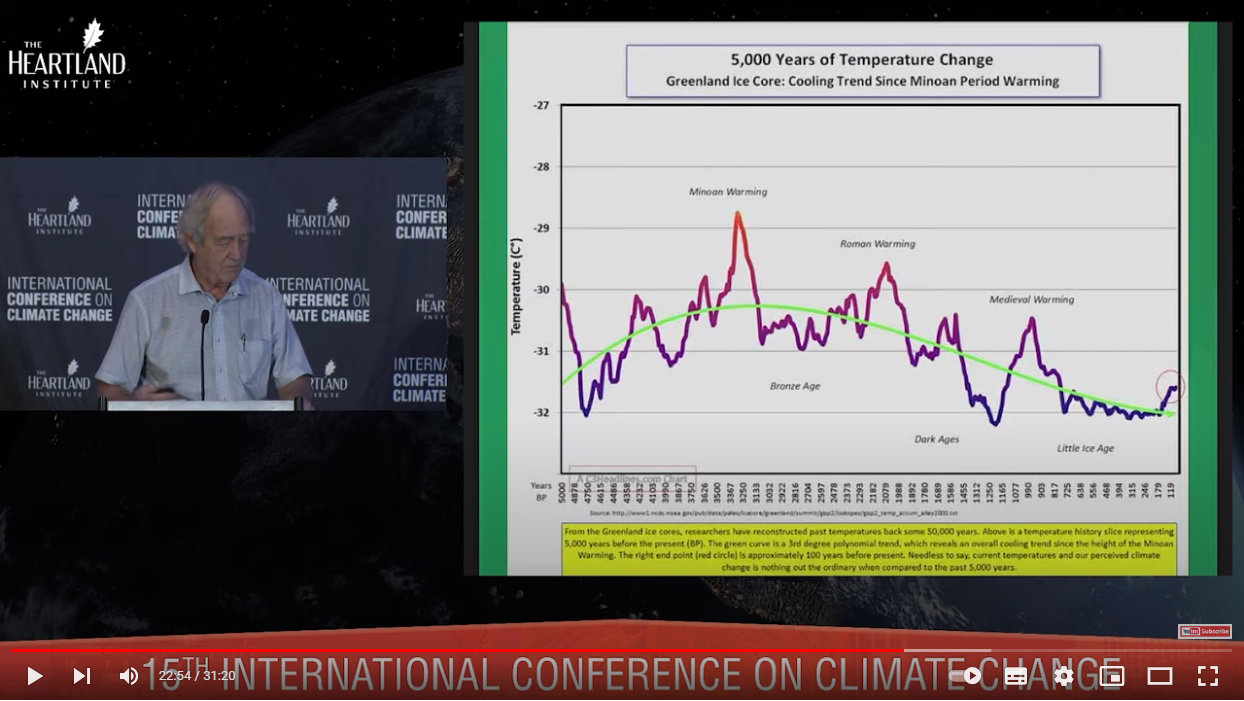
Here’s another temperature graph, of just the past 5,000 years:
Source: https://youtu.be/GH8v5aCbZBs?t=1374
The Little Ice Age shown at the far right spanned from the 16th to 19th centuries.
This graph shows CO2 levels alongside temperature data taken in central England from when the thermometer was invented. CO2 has had no effect whatsoever on temperature during this entire period (1659-2009):
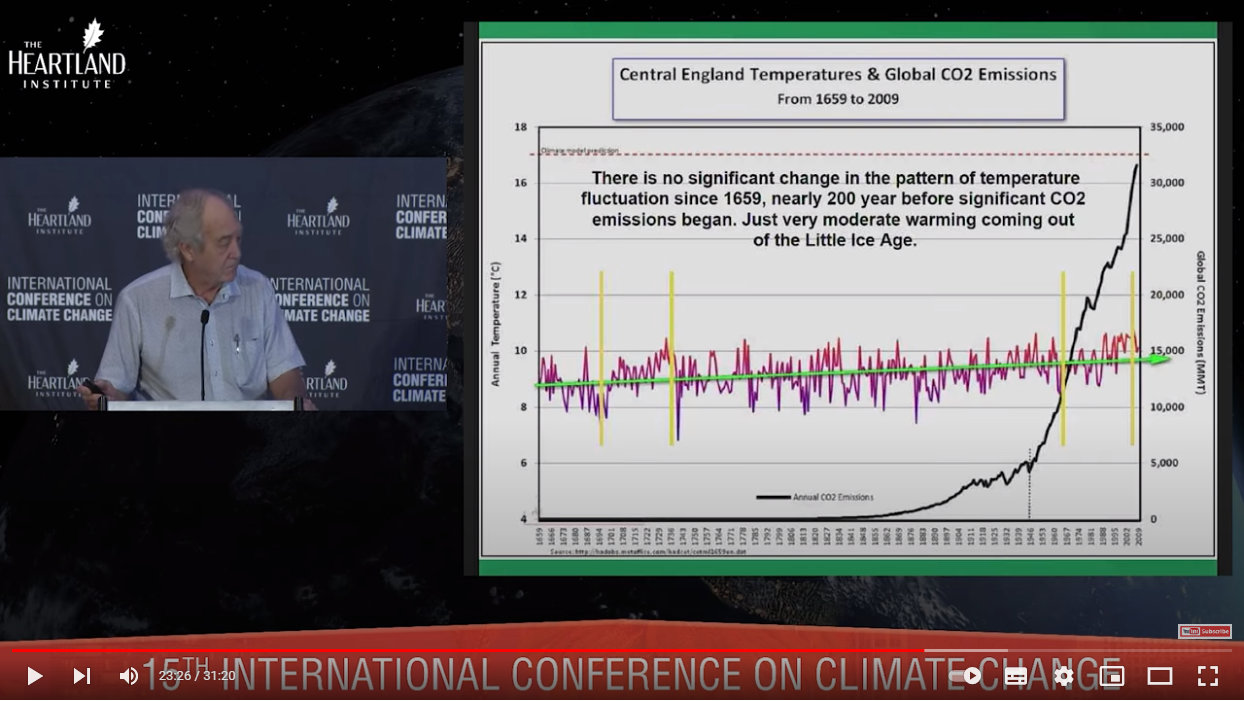
Source: https://youtu.be/GH8v5aCbZBs?t=1406
I could show graph after graph of data such as these, but further discussions on temperatures and CO2 must wait until the next post! This post is meant to be about the biosphere and CO2, so let’s resume.
The Biosphere
This image from 2010 shows where all the carbon is, and is the source for the section above stating that 100 quadrillion tons of organic carbon has been locked away. (The units, not shown, are apparently ‘billions’):
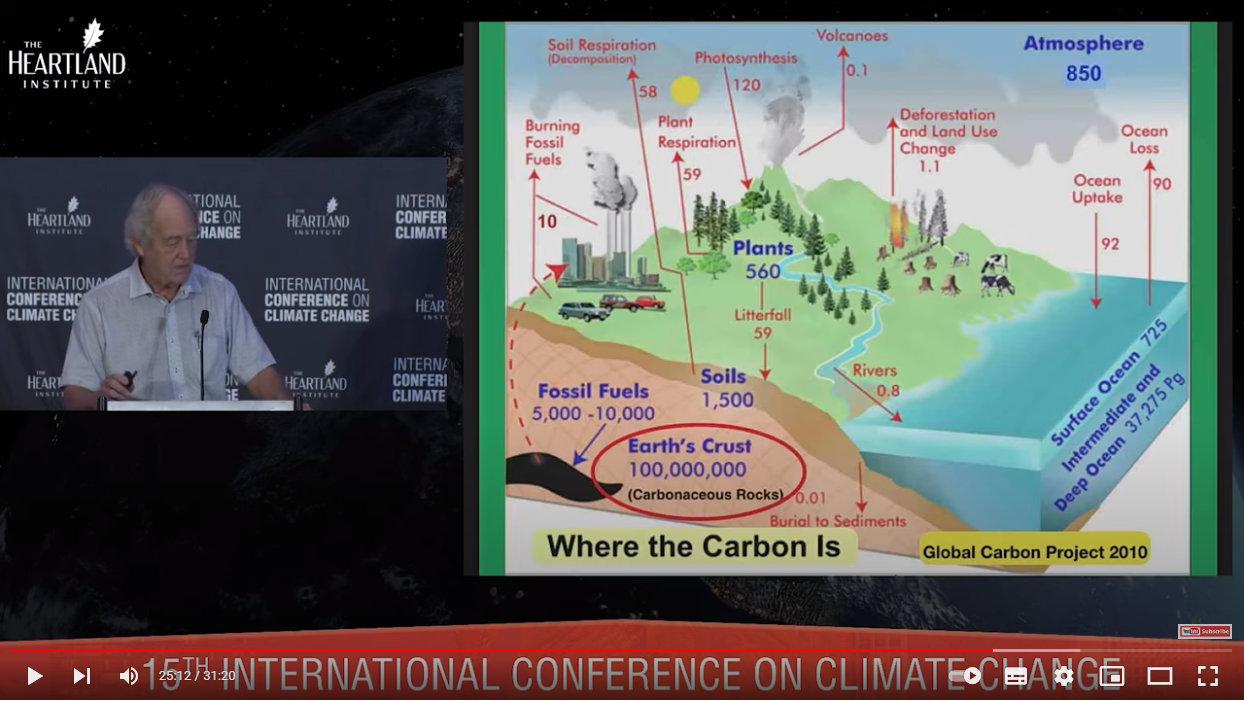
Source: https://youtu.be/GH8v5aCbZBs?t=1512
Oil, gas and coal reserves are but a fraction in comparison, and the burning of these is miniscule in comparison to just how much carbon is unavailable for release back into the atmosphere. Non-human release of CO2 into the atmosphere outweighs any from human activities, and photosynthesis more than compensates for any human-released CO2 anyway.
CO2 is plant food. The Earth is greening as CO2 levels slowly increase from their absolute lowest point of 275 ppm (0.0275%) in the early 1600s:
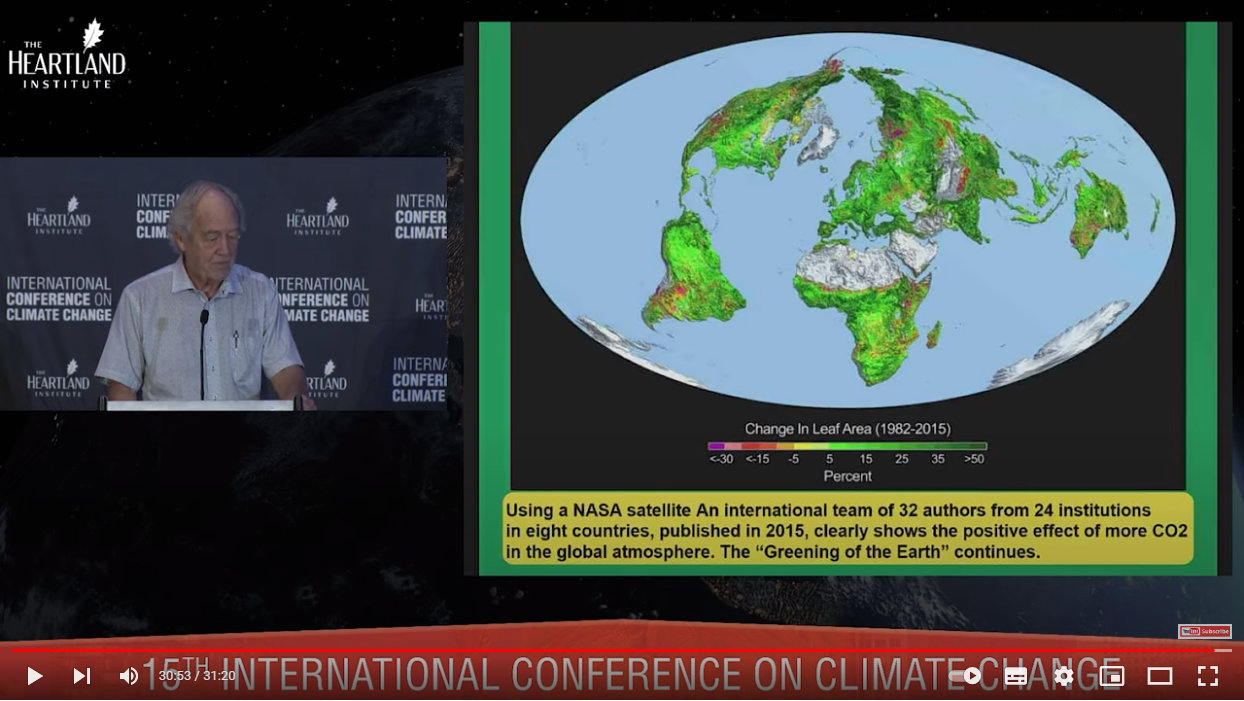
Source: https://youtu.be/GH8v5aCbZBs?t=1853
Why is this bad?
In Conclusion
Current CO2 levels — and temperatures — are amongst the lowest they have ever been in the entire 500 million year history of multicellular life on Earth. The global temperature has risen just 0.5 °C since 1880, and any apparent warming is only because we are exiting a little ice age which ended in the 19th century (not to be confused with the Pleistocene ice age which ended 11, 700 years ago).
Further, any apparent warming since the 19th century is taken completely out of context when not compared to the scale of geological eras which span millions of years.
The Cambrian explosion saw the arrival of multicellular life, and with it a dramatic increase in biomass. Biomass is made from organic carbon molecules such as proteins, fats and carbohydrates, and a species’ carbon needs increase proportionally for each additional cell it is made of.
Every single carbon atom in these molecules was once a carbon atom in inorganic CO2. Autotrophs are the only organisms able to ‘fix’ carbon, by pulling it out of the air and placing it into carbohydrates. Once ‘fixed’ as carbohydrate, carbon can then move through food chains and support still other lifeforms.
As autotrophs became multicellular, they were able to fix more carbon. More available carbon enabled still larger and more complex organisms to evolve. Thus as global biomass increased more and more, fixing of atmospheric CO2 increased more and more. Demands on CO2 increased still more with the evolution of calcium carbonate shells and giant trees. And as CO2 levels began to drop millions of years ago, new species such as C4 and CAM plants evolved to cope.
CO2 is thus a nutrient, and a highly sought-after one at that, on land and in water. The biosphere is never a passive bystander but is intricately linked to the three other −spheres, and accordingly, will rise and fall with the rise and fall of CO2 availability as it rises and falls with every other −sphere input.
About the Author
BSc(Hons), U.Syd. - double major in biochemistry and microbiology, with honours in microbiology
PhD, U.Syd - soil microbiology
Stumbled into IT and publishing of all things.
Discovered jujube trees and realised that perhaps I should have been an agronomist...
So I combined all the above passions and interests into this website and its blog and manuals, on which I write about botany, soil chemistry, soil microbiology and biochemistry - and yes, jujubes too!
Please help me buy a plant if you found this article interesting or useful!