My Take on the Carbon Dioxide Narrative: Part 3: The Sun and Sunspots
Introduction
Let us revisit Dr Soon, and two more slides from that brilliant talk.
As with the previous posts, the screenshots below are direct links to the timestamp they were taken at, for people to view more detail if they wish.
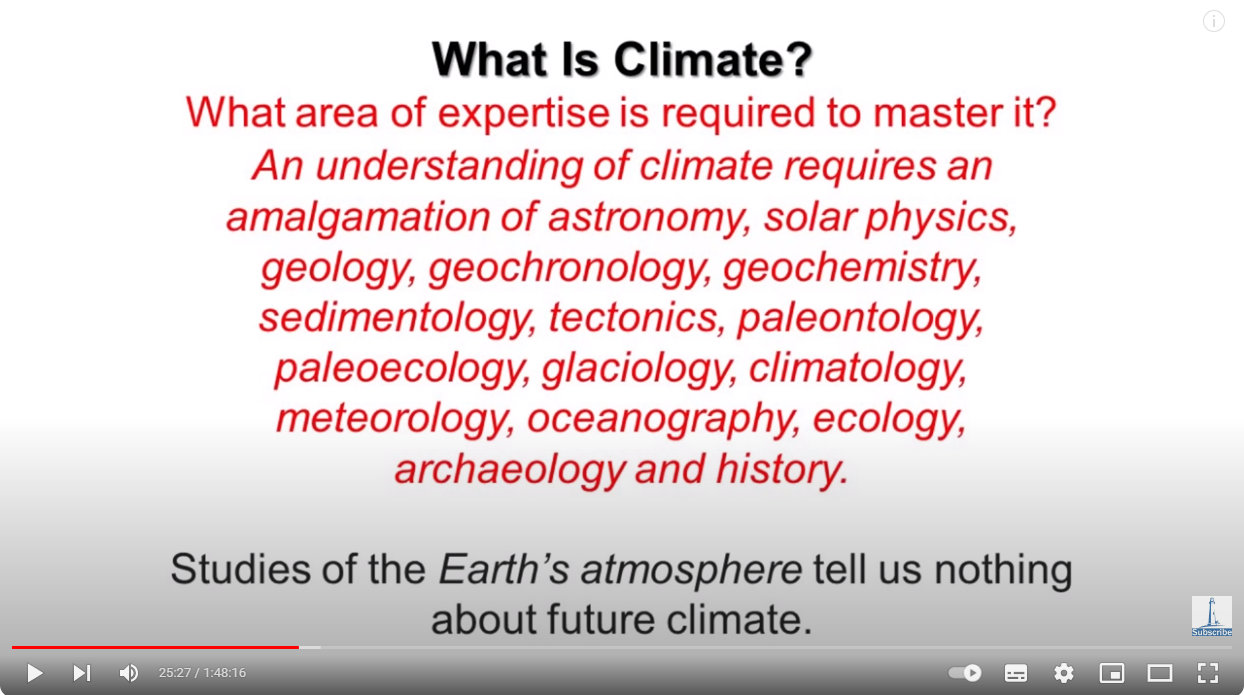
Please take the time to study this slide and absorb what it is saying.
Source: https://youtu.be/1zrejG-WI3U?t=1527
I am seriously impressed a geoscientist and astrophysicist included ecology and paleoecology as contributors to climate — a non-life-scientist acknowledging the importance of the oft-overlooked and ignored biosphere is a well-read, learned man in my books!
The take-home message is this: the climate is so complex a system, that many diverse (and overlapping) scientific fields must come into play just to begin to understand it. (The subtle subtext is: “to say that rising CO2 leads to warming is just too simple a claim to make with any credibility.")
But focus on the last sentence: “Studies of the Earth’s atmosphere tell us nothing about future climate.“
So very true. What does knowing that the atmosphere — with its CO2 concentration of 400 ppm — dumped 29.4 mm here last month tell us anything about the weather in September 2123, whether here or on the other side of the world? Never mind what the CO2 concentration then will be…
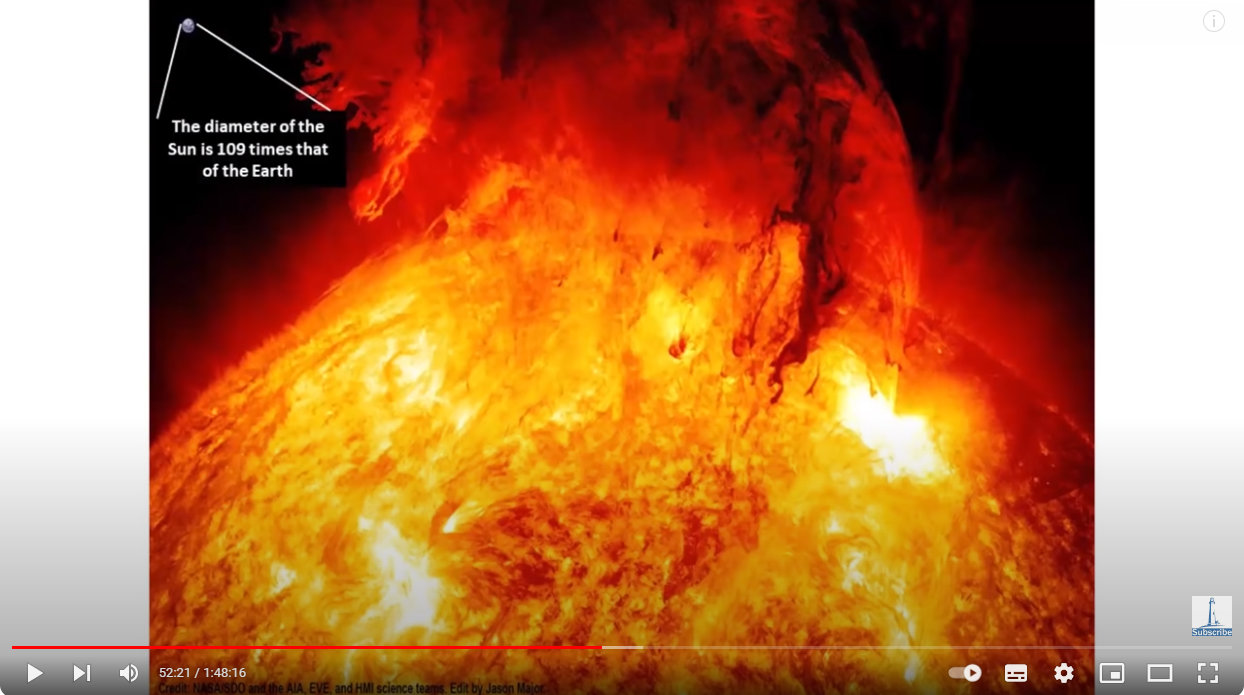
This next slide is a segue into the focus of this particular post — the Sun.
Source: https://youtu.be/1zrejG-WI3U?t=3141
Dr Soon’s area of study is the Sun-climate connection, and if you click on that screenshot you’ll hear more on that from him.
I include this image for the same reason he does — to show how enormous the Sun is! I wouldn’t even have noticed that dot called Earth was there if it weren’t for the words and lines drawing attention to the top left.
The Sun
The Sun’s mass is 330, 000 times that of the Earth — this mass is almost 99.9% of the total mass of the Solar System!
The surface temperature of the Sun is about 5, 800 Kelvin (5, 800 K) and the core is about 15.7 million K.
[A unit of Kelvin is equivalent to a degree Celsius, but there are no negative Kelvin values. 0 K defines absolute zero, the temperature at which all molecular motion is theorised to cease. 0 K equals −273.15 °C.]
600 million tonnes of hydrogen is fused into helium in the Sun’s core every second, converting 4 million tonnes of matter into energy. This energy, which we know as the Sun’s light and heat, takes from 10, 000 to 170, 000 years to escape the Sun’s core. A photon of light leaving the Sun’s surface takes 8 minutes to reach Earth.
This light is so intense that viewing the Sun with a naked eye can lead to irreparable damage.
How can this giant fiery ball in the sky, of enormous mass and bombarding our planet constantly with mind-boggling amounts of energy, not influence Earth’s temperature directly, and its climate indirectly?
Sunspots and Solar Activity
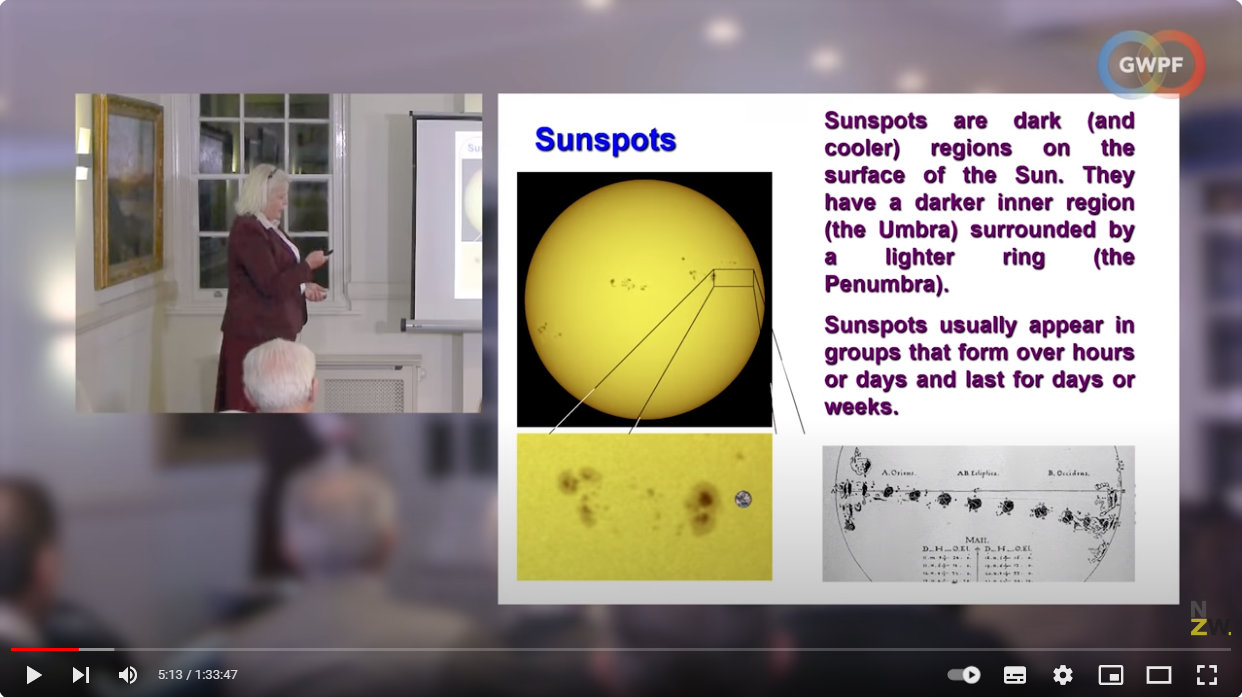
The screenshots below are from a different video presentation by another astrophysicist: Professor Valentina Zharkova: The Solar Magnet Field and the Terrestrial Climate, who will feature more in Part 4. For now, these screenshots are included as an introduction to sunspots, and again are direct links to the timestamps they were taken at.
Sunspots are darker and cooler regions on the Sun’s surface, anywhere from 16 – 16, 000 km in diameter and of 3, 000 – 4, 500 K in temperature.
Source: https://youtu.be/M_yqIj38UmY?t=313
Though they look dark against the Sun’s surface, any one sunspot would shine brighter than the full moon if isolated. They have a lifespan of days to months, and all eventually decay.
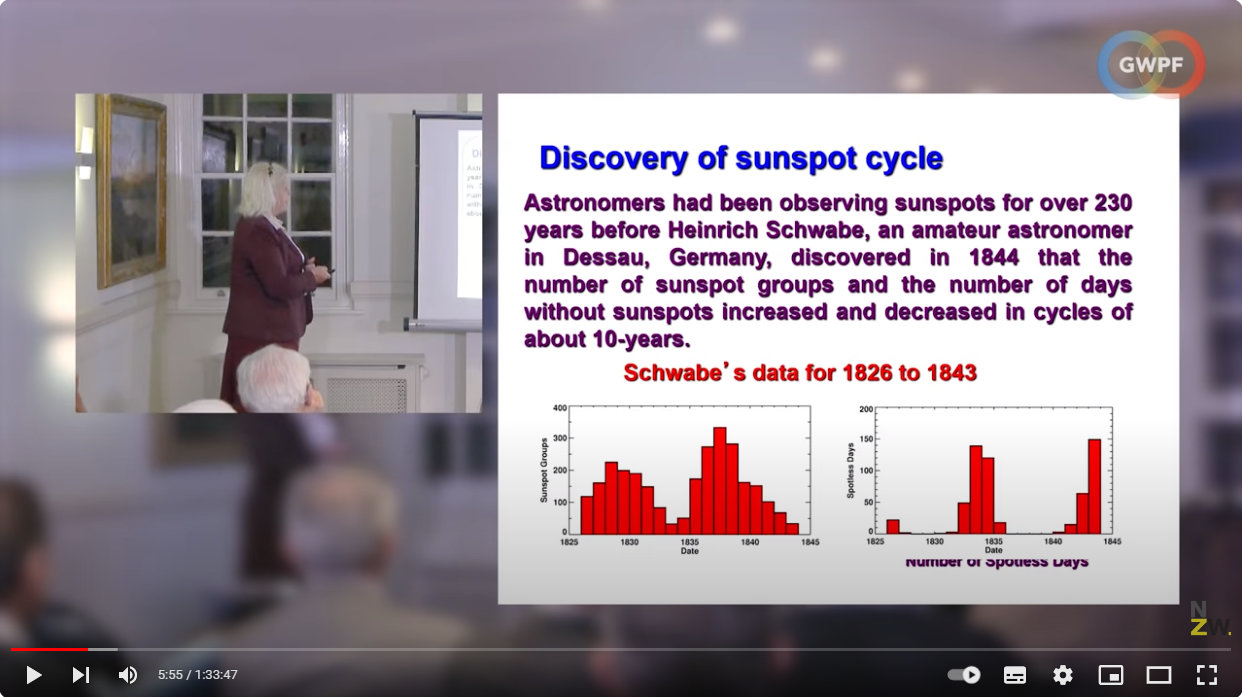
Heinrich Schwabe in 1844 was the first to discover that sunspots followed a ten to twelve year cycle of increasing then decreasing number. The period of highest sunspot number in a cycle is called a solar maximum and that of lowest number a solar minimum.
Source: https://youtu.be/M_yqIj38UmY?t=355
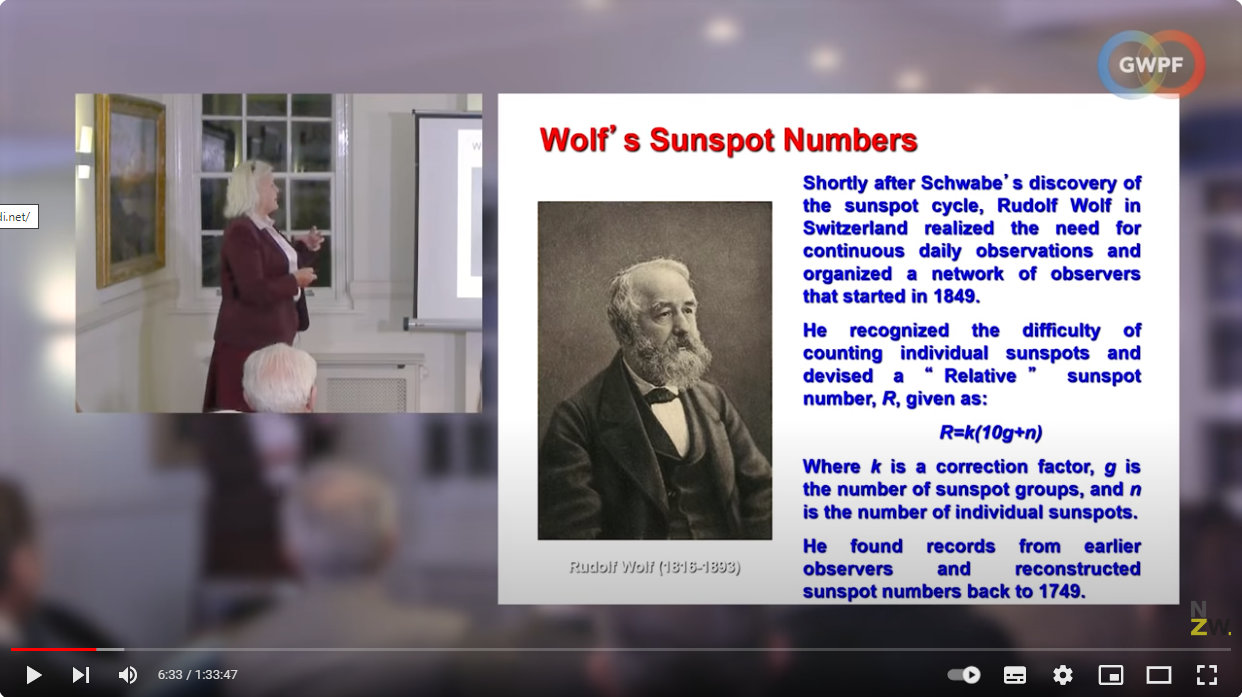
Rudolf Wolf in 1849 devised a formula to calculate relative sunspot numbers:
Source: https://youtu.be/M_yqIj38UmY?t=393
From which sunspot numbers going back to 1749 could be calculated from earlier records.
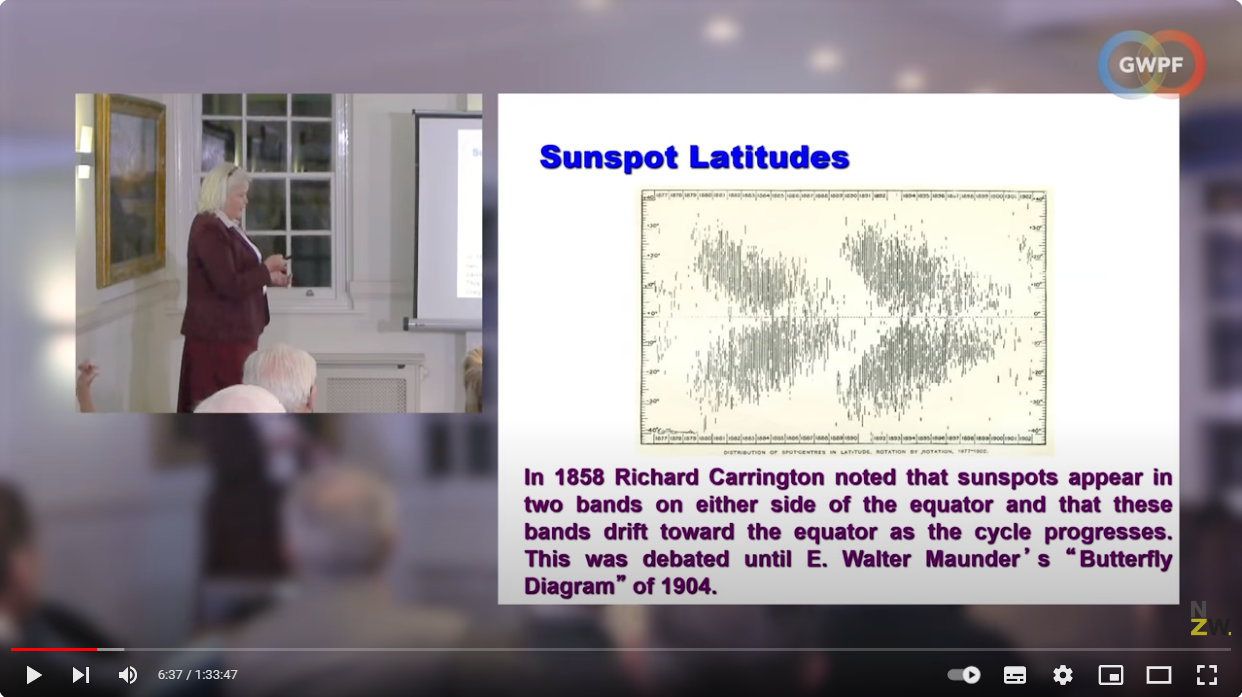
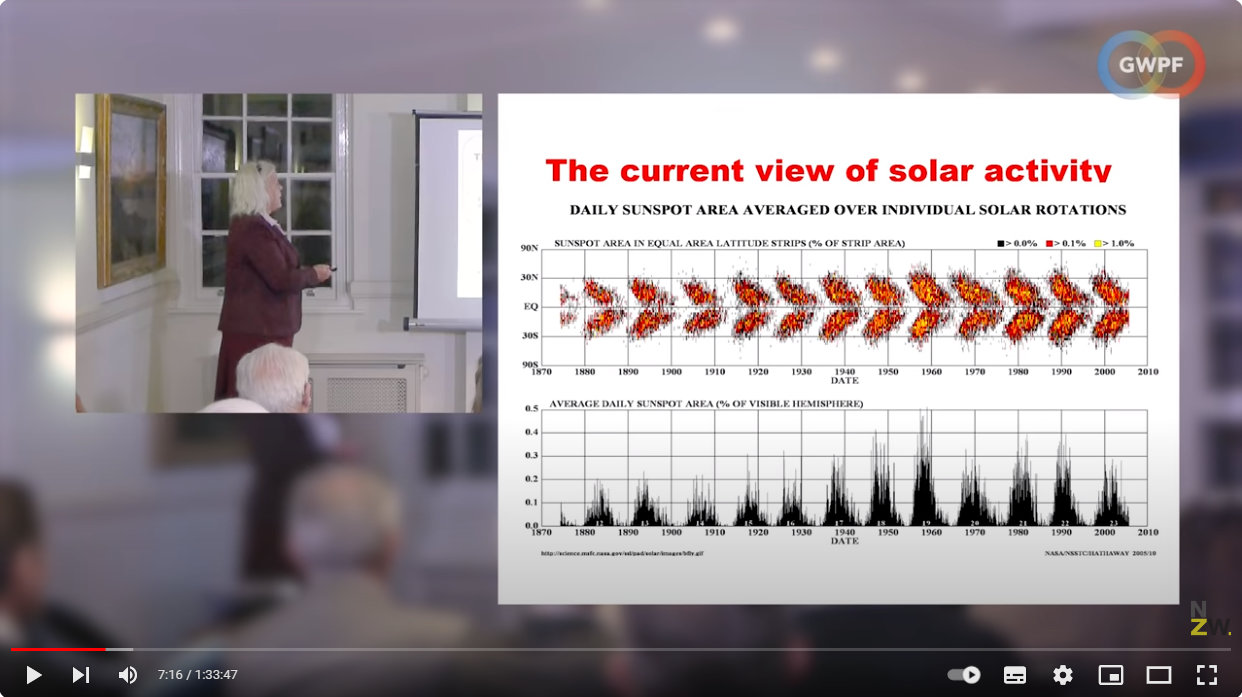
Richard Carrington in 1848 discovered that sunspots originated at the beginning of each cycle in higher latitudes either side of the equator, where they were most numerous (a solar maximum). These drifted towards the equator where they petered out during a solar minimum, ahead of the cycle beginning anew.
Source: https://youtu.be/M_yqIj38UmY?t=397
Source: https://youtu.be/M_yqIj38UmY?t=436
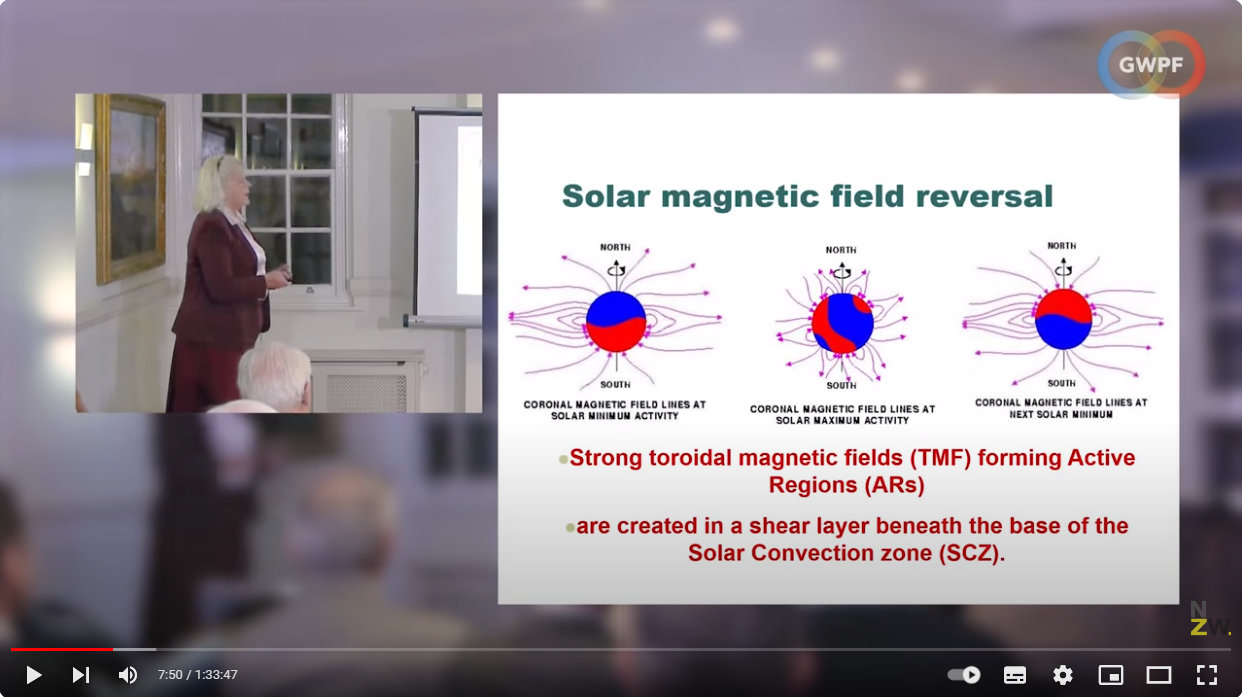
The Sun’s magnetic field is generated by a process called the solar dynamo. The north magnetic field is in the northern hemisphere during a solar minimum, but by the solar maximum the polarity has fully reversed and north is in the southern hemisphere.
Source: https://youtu.be/M_yqIj38UmY?t=470
The Sun’s equator rotates faster than the poles, and this together with the moving magnetic field creates twists called toroidal (doughnut-shaped) fields — sunspots are these toroidal magnetic fields.
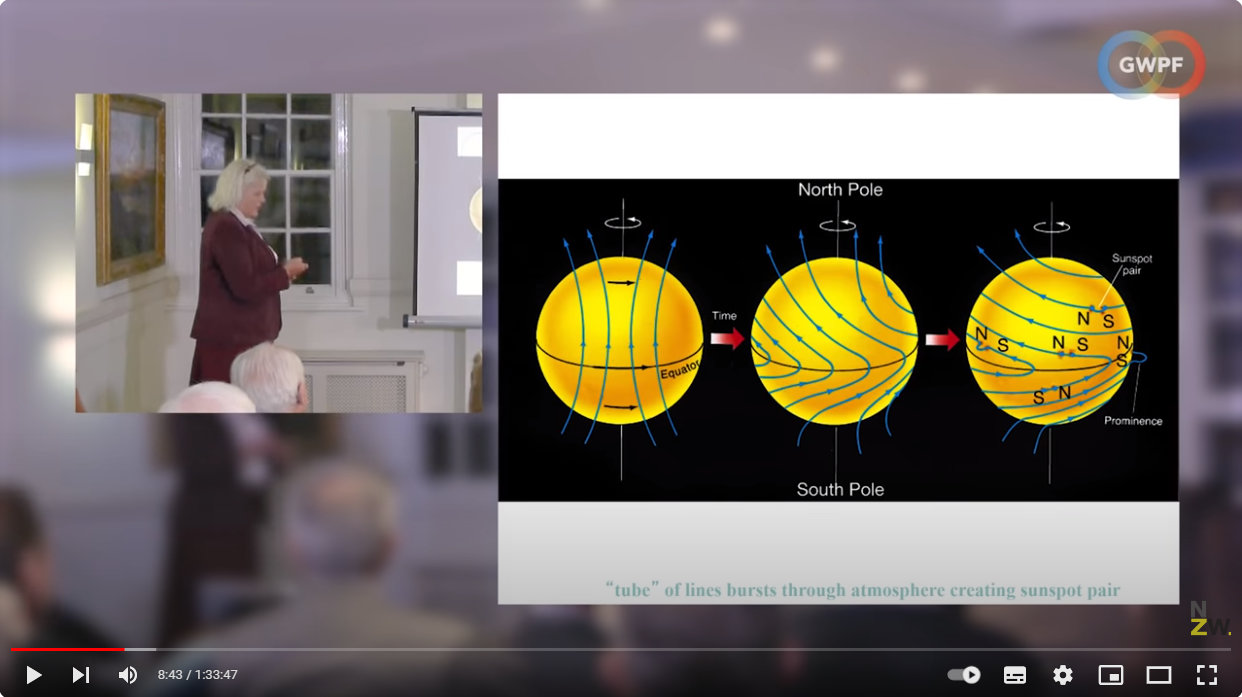
Source: https://youtu.be/M_yqIj38UmY?t=546
Solar Activity and Climate
The outer atmosphere of the Sun is called its corona, and it was discovered in the 1980s that coronal activity (brightness) increased with increased sunspot number.
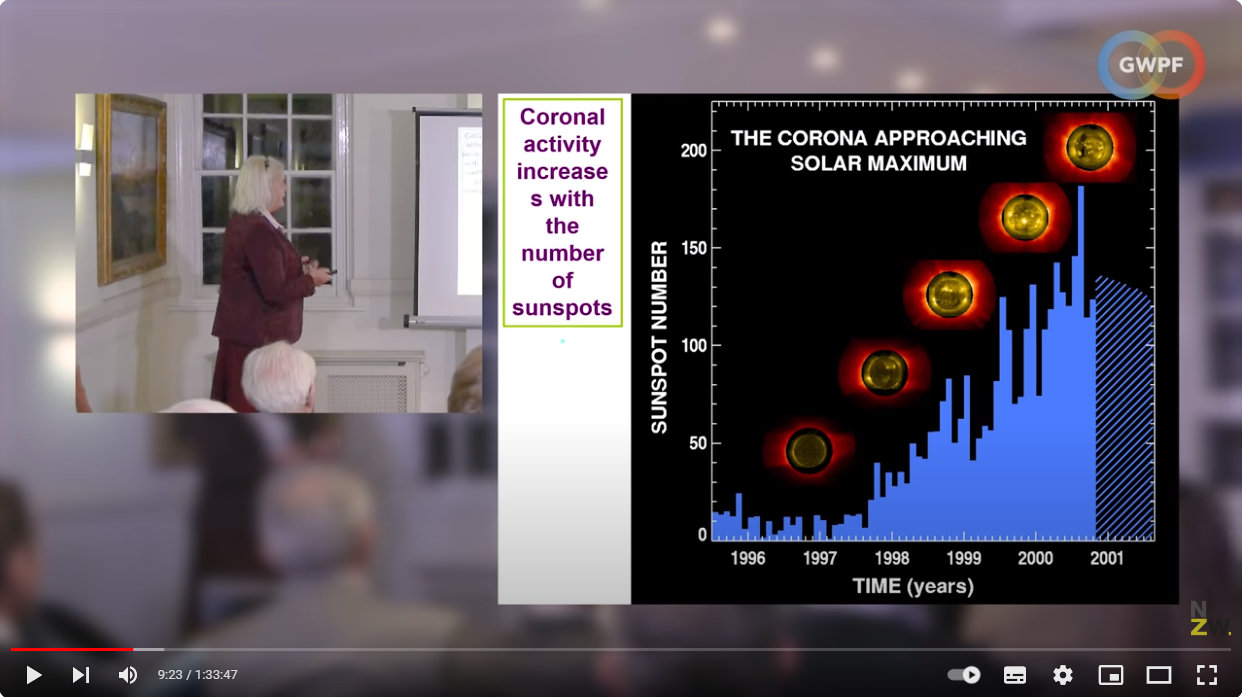
Source: https://youtu.be/M_yqIj38UmY?t=563
Here is a graph of sunspot observations over 400 years:
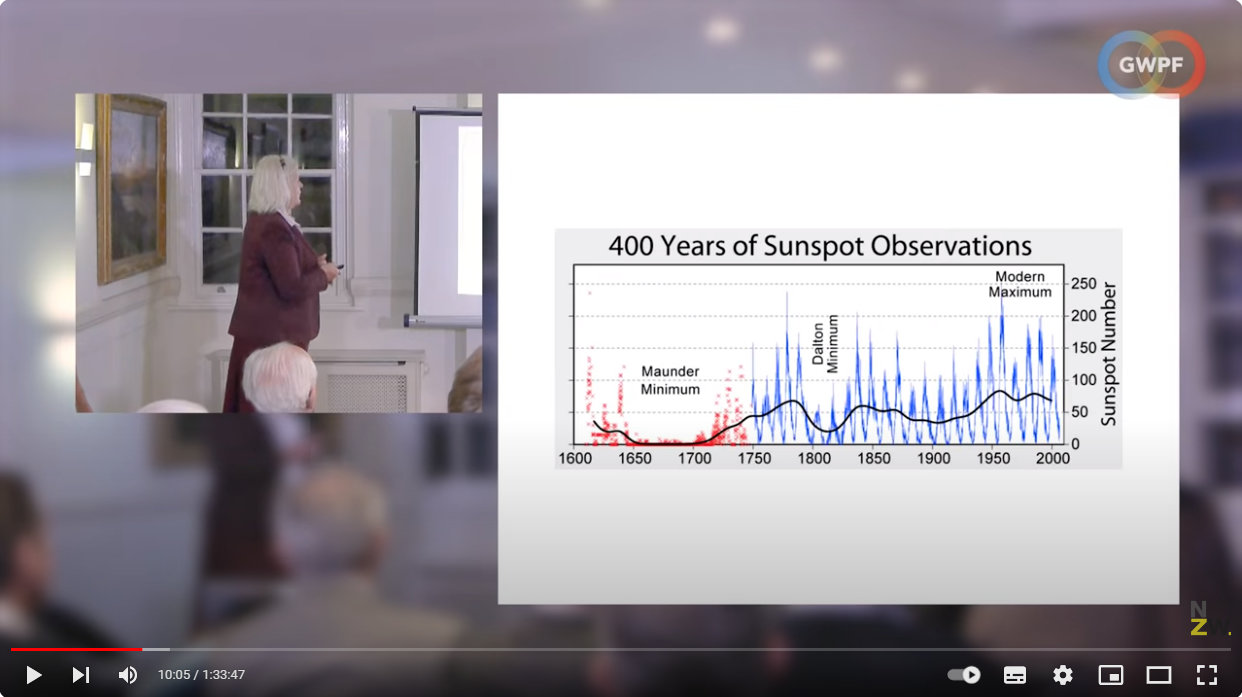
Source: https://youtu.be/M_yqIj38UmY?t=605
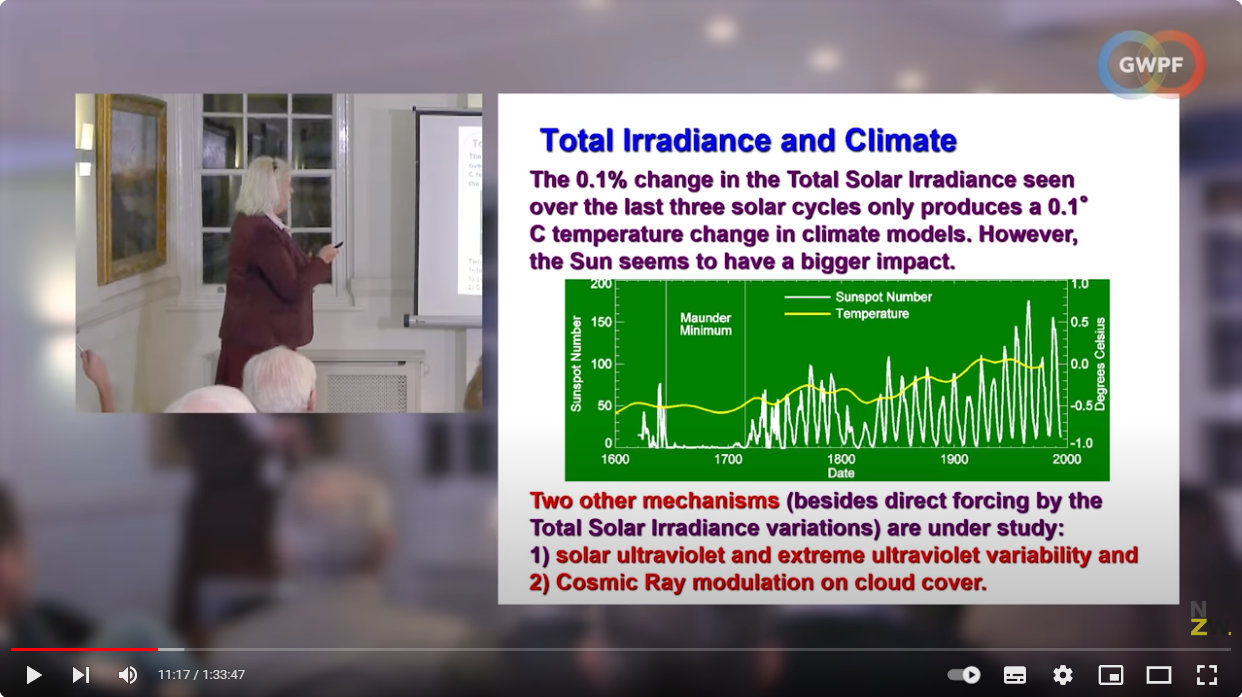
A total of fifty sunspots were recorded over a 28 year period spanning 1672 until 1699. (There is a table here.) Today you would expect 40, 000 to 50, 000 in the same timeframe. This period coincided with the coldest part of the Little Ice Age, and became known as the Maunder Minimum.
Jack Eddy was the first to connect the temperature of the Earth with the sunspot activity of the Sun.
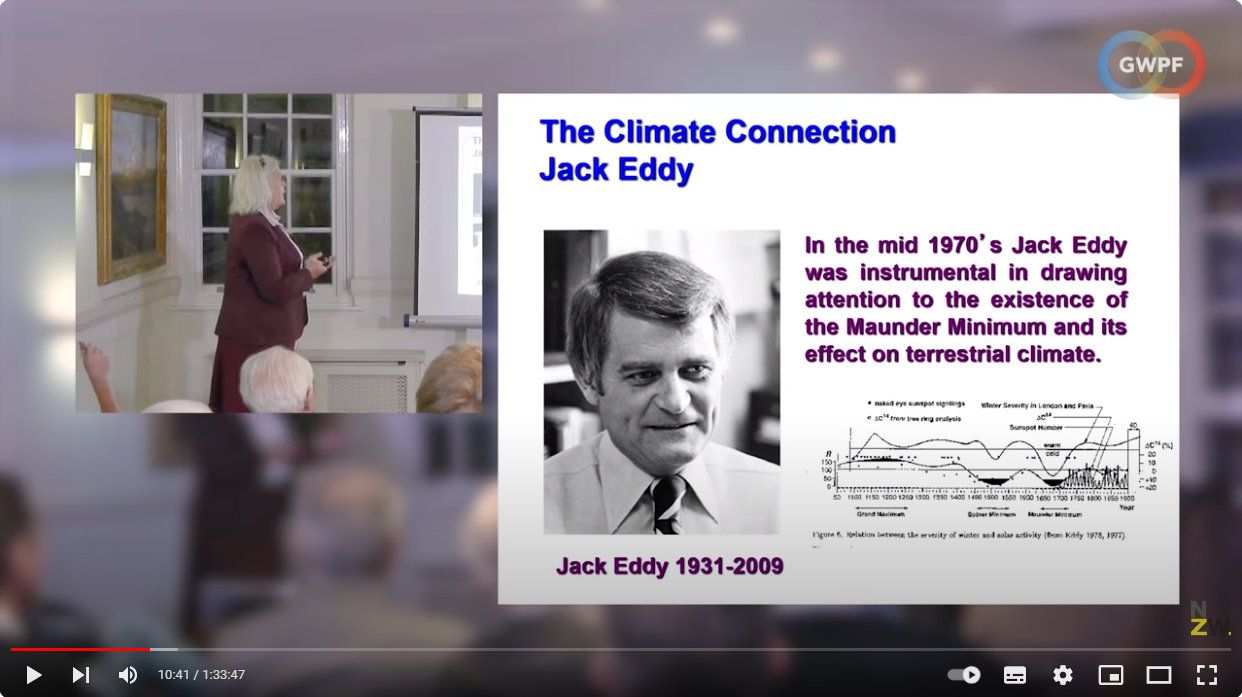
Source: https://youtu.be/M_yqIj38UmY?t=640
Temperature cycles with sunspot numbers:
Source: https://youtu.be/M_yqIj38UmY?t=677
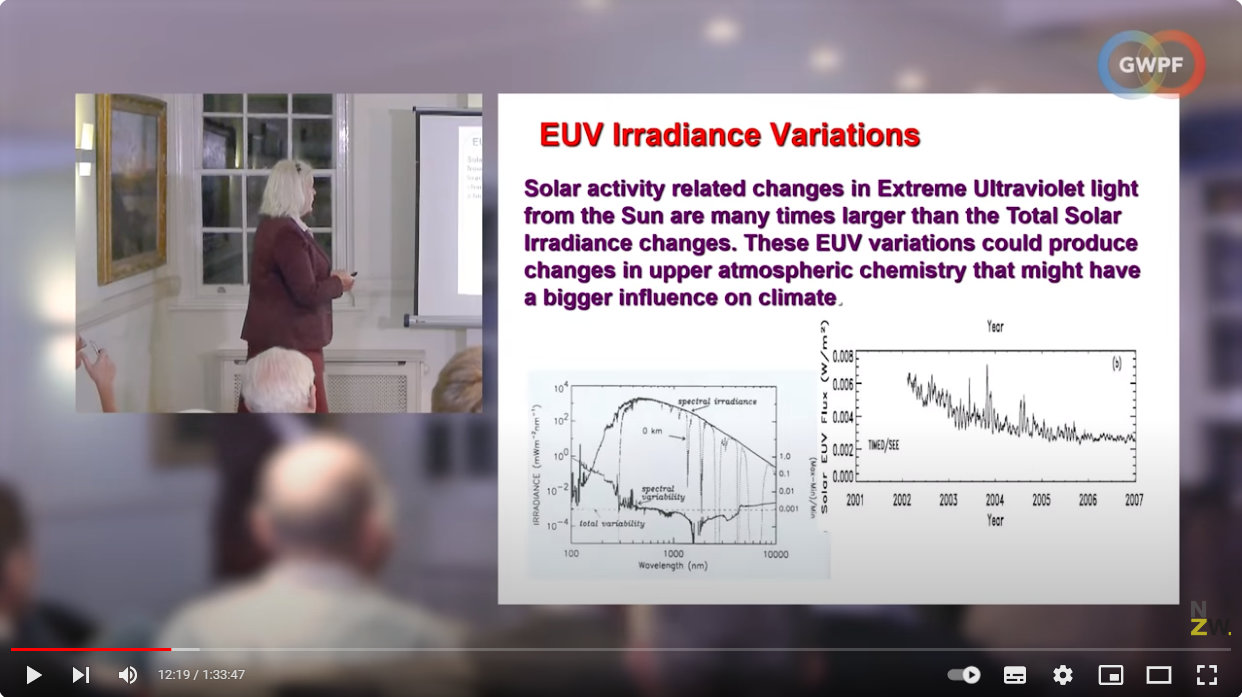
Extreme ultraviolet emissions from the Sun also appear influential:
Source: https://youtu.be/M_yqIj38UmY?t=739
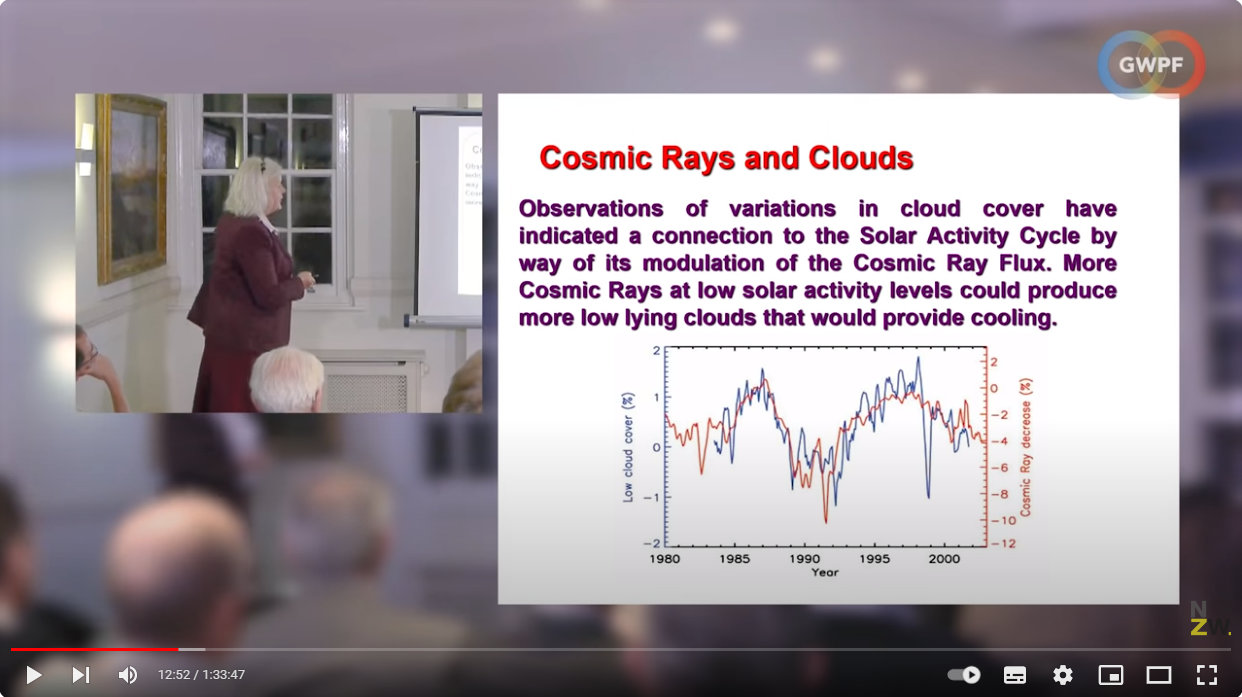
There is also a strong correlation between cosmic rays and cloud cover:
Source: https://youtu.be/M_yqIj38UmY?t=772
As described in this post:
‘Cosmic radiation’ is made of high-energy particles such as hydrogen ions (protons) and other atomic nuclei (containing protons), and which originate mostly from outside the solar system. The sun’s magnetic field protects the solar system from bombardment by these particles, but more will ’slip through’ and enter Earth’s atmosphere during a solar minimum, as there is less sunspot, solar flare, and solar wind activity to push them away.
The rest of Professor Zharkova’s talk becomes very technical and mathematical very quickly, delving into concepts way beyond my ken, such as eigenvectors and eigenvalues. This showing of work and how conclusions were made is very typical — and expected — of a presentation before peers, not laypeople like me, and it is easier to summarise her findings by simply quoting directly from the description field below the video:
Principal component analysis (PCA) of the solar background magnetic field observed from the Earth, revealed four pairs of dynamo waves, the pair with the highest eigen values are called principal components (PCs).
PCs are shown to be produced by magnetic dipoles in inner and outer layers of the Sun, while the second pair of waves is assumed produced by quadruple magnetic sources and so on. The PC waves produced by a magnetic dipole and their summary curve were described analytically and shown to be closely related to the average sunspot number index used for description of solar activity. Based on this correlation, the summary curve was used for the prediction of long-term solar activity on a millennial timescale. This prediction revealed the presence of a grand cycle of 350-400 years, with a remarkable resemblance to the sunspot and terrestrial activity features reported in the past millennia: Maunder (grand) Minimum (1645-1715), Wolf (grand) minimum (1200), Oort (grand) minimum (1010-1050), Homer (grand) minimum (800-900 BC); the medieval (900-1200) warm period, Roman (400-10BC) and other warm periods.
This approach also predicts the modern grand minimum upcoming in 2020-2055. By utilising the two principal components of solar magnetic field oscillations and their summary curve, we extrapolate the solar activity backwards one hundred millennia and derive weaker oscillations with a period of 2000-2100years (a super-grand cycle) reflecting variations of magnetic field magnitude. The last super-grand minimum occurred during Maunder Minimum with magnetic field growing for 500 years (until ~2150) and decreasing for another 500 years. The most likely nature of this interaction will be discussed and used to explain long-term variations of solar magnetic field and irradiance observed from the Earth.
In short, Zharkova and her team derived a mathematical formula so astonishingly accurate that it fit the main grand minima and warming periods from the past 3, 000 to 10, 000 years. When run backwards 100, 000 years (!), this same model showed that there were cycles within cycles — grand cycles and super grand cycles. And that the next grand solar minimum since the Maunder Minimim was just around the corner, from 2020 – 2055.
This talk was given in 2018. NASA confirmed in 2020 that we had entered a new solar minimum in December 2019.
The Earth will heat and cool, not from our activity, by by the Sun’s, in a constant cycle spanning thousands and thousands of years. The Sun is actually a very stable oscillator, as evidenced by the incredible accuracy of Professor Zharkova’s mathematical predictions. At the 42:36 minute mark, she makes the valid observation that when there was maximum heating of the Earth, the polar ice caps of Mars were simultaneously melting and there was a typhoon on Jupiter — all influences of the Sun on the Solar System, not us.
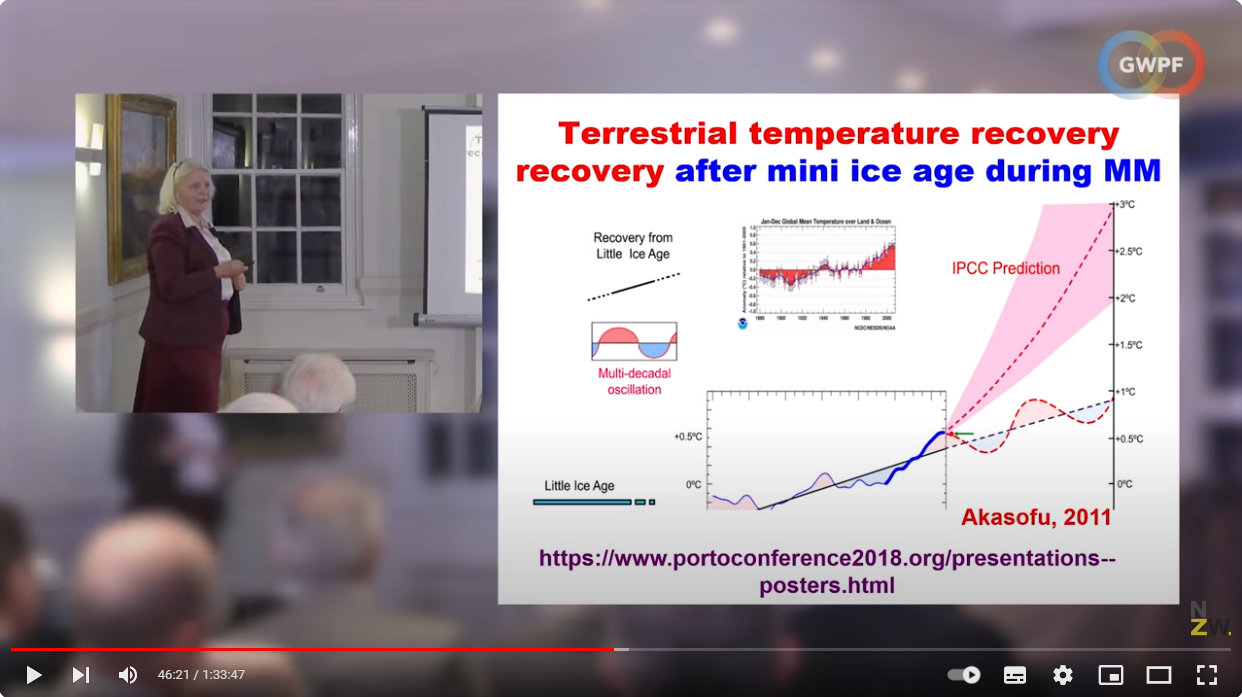
This heating and cooling can be seen in the following graph, where temperatures have been cycling from low to high in a slow upward trend since the Maunder Minimum, and not in a rapid acceleration from some arbitrary point which isn’t even an inflection on the graph from which it is drawn:
Source: https://youtu.be/M_yqIj38UmY?t=2781
After Syun-Ichi Akasofu showed this to be an oscillating function in a 2011 paper, the IPCC was forced to revise its linear interpolation downwards from a 3 degree increase to a 2 degree increase, but it is still so glaringly bad a projection one audience member couldn’t hep but laugh, which prompted a most jovial impromptu laugh from Zharkova in return!
But why is the temperature oscillating in a slowly upward trend? (For now — it will again oscillate in a slow downward trend eventually.)
This is because while sunspot activity (changes in the Sun’s magnetic field) determines the cyclical increases and decreases in temperatures over hundreds of years, it is the enveloping supercycles determined by astrophysics which cause increases and decreases over millenia. And it is the astrophysics — specifically the interplay between the Sun and the Solar System known as heliophysics — which will be covered in Part 4!
About the Author
BSc(Hons), U.Syd. - double major in biochemistry and microbiology, with honours in microbiology
PhD, U.Syd - soil microbiology
Stumbled into IT and publishing of all things.
Discovered jujube trees and realised that perhaps I should have been an agronomist...
So I combined all the above passions and interests into this website and its blog and manuals, on which I write about botany, soil chemistry, soil microbiology and biochemistry - and yes, jujubes too!
Please help me buy a plant if you found this article interesting or useful!